
UCAS Clearing and Acceptance Numbers 2024

Image courtesy of Adobe
One day on from A-Level Results Day on 16 August 2024, StuRents has examined the latest available acceptance data from UCAS to highlight key trends and notable year-on-year (YoY) changes. Bear in mind that these figures will continue to evolve throughout Clearing.
Total acceptances
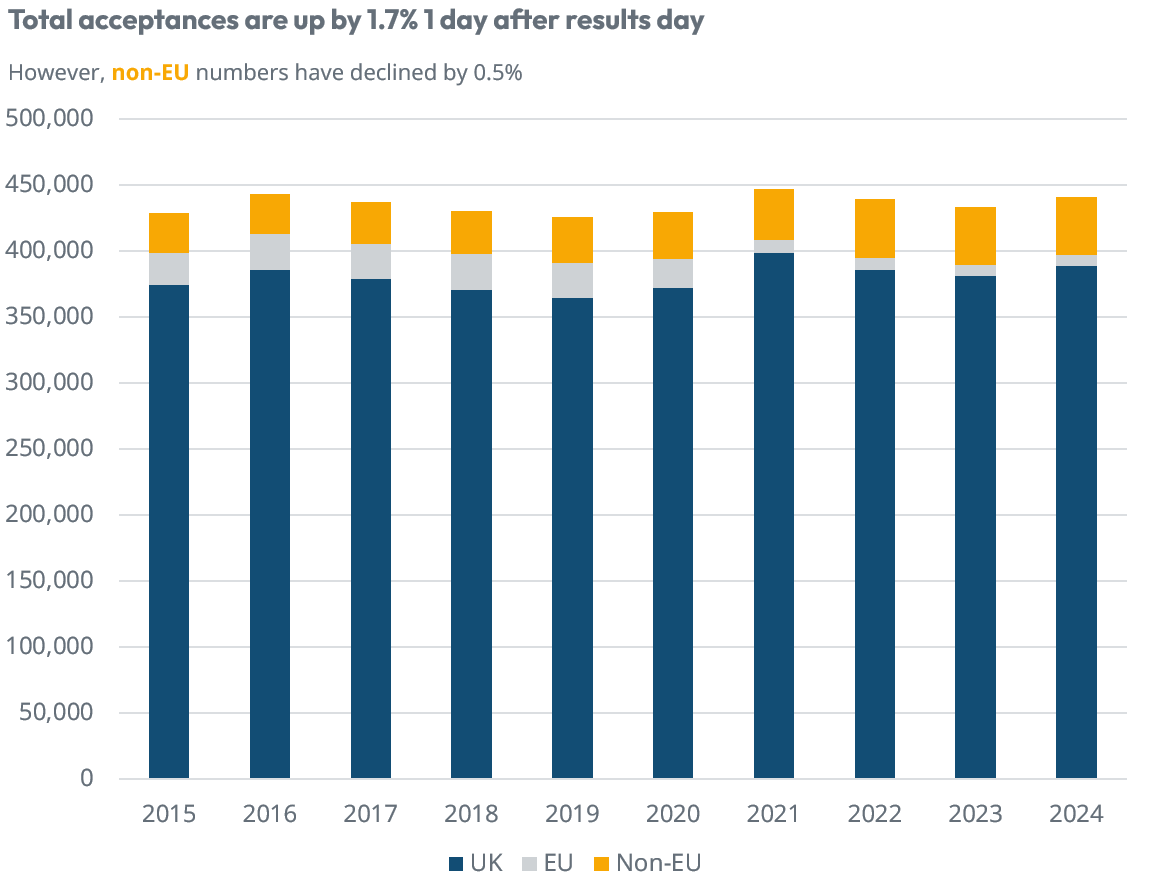
[Source: UCAS]
One day post Results Day, total acceptances are up by 1.7% YoY, driven by 2.0% UK growth. However, total acceptances are down by 1.4% vs the 2021 high.
Non-EU acceptances are down slightly YoY by just 0.5%. By contrast, EU acceptances seem to have stabilised, down by just 0.4% YoY in 2024, after a dramatic decrease of 69.5% in 2023 vs 2019.
Non-EU acceptances

[Source: UCAS]
Looking at non-EU acceptances specifically, we have seen a 6.3% decline in Chinese acceptances YoY. In 2024, Chinese acceptances are also down by 17.9% vs the recorded peak in 2022. However, the overall trend for Chinese acceptances is still positive, with acceptances up 10.5% vs 2021.
Indian acceptances are down 2.3% YoY in 2024. However, the overall trend is also still positive, with acceptances up 41.4% vs 2021.
Nigerian acceptances have decreased significantly, down 37.8.5% YoY. This decline follows a significant decrease in applications from Nigeria, with a YoY decrease of 2,450 applications reported, equating to almost 50% fewer applicants. This is likely linked to the current economic crisis in Nigeria.
Higher tariff vs lower tariff provider acceptances

Higher tariff providers equated to 37.3% of all acceptances, the highest level recorded in recent history.
Lower tariff providers continued a downward trend, with acceptance numbers falling 3.2% YoY, down 15.8% since 2015.
Clearing numbers

Glasgow and London have the highest number of courses available through Clearing, both offering over 1,000 each (1,071 and 1,065 courses available respectively). These locations also have some of the highest rents in the UK. The average rent in Glasgow for student accommodation is £204.09pppw (weighted across PBSA and HMOs), while it is £271pppw in London.
Key takeaways
- Total acceptances are up by 1.7% YoY
- Non-EU acceptances are down by 0.5% YoY
- Chinese acceptances are down by 17.9% vs 2022 but the overall trend remains positive vs 2021
- Higher tariff providers equated to 37.3% of all acceptances
- Glasgow and London have the highest number of courses available through Clearing (>1000 each)
Want more insights?
Contact the StuRents Intelligence team for more information about how to access our proprietary, independent UK student accommodation data.
Book a demo of our StuRents Data Portal to find out how you can have up-to-the-minute university housing insights at your fingertips.
Share

Article by
Copywriter & Content Marketing Executive at StuRents
Honor is a Copywriter & Content Marketing Executive, working within the Marketing team to create content for StuRents.
