
Supply and demand of student accommodation: why student-to-bed ratios can be misleading

Image courtesy of Flickr
Supply and Demand Data
Organisations operating in the student sector - particularly investors and financial institutions - need metrics to appraise current and future market performance. Understanding how supply and demand compare, and how this is changing over time, is a crucial part of this analysis, with good quality data underpinning any decision-making. Student-to-bed ratios (SBRs) are a commonly used metric, however they are simplistic and opaque, often incorporating optimistic or dubious assumptions around total demand for PBSA. Market behaviour is unpredictable and complex, so in this article we’re taking a look at where SBRs fall short, and better ways to look at market fundamentals.
Firstly, it’s important to explore what data is typically available for supply and demand analysis for a given market. On the supply side, data availability varies, but for Purpose Build Student Accommodation (PBSA) it’s more readily available - some organisations track this themselves through independent research (through listings platforms, announcements and planning portals), while others purchase data through third parties. Estimates of supply are relatively accurate but the numbers should still be treated with caution, given fluctuations with beds entering and leaving a market with minimal or no notice. Pipeline and planning applications can be tracked and available similarly, with systematic searches.
HMO numbers however are less readily available given the nature of the assets, are calculated through a mix of sources including local councils, listings data and balance of demand; that is, taking the students in a market that need accommodation, the amount of PBSA and other known accommodation, and calculating HMO beds as the difference between these (on the assumption that these students need to live somewhere). Overall, HMO bed counts have a lot of uncertainty, but these estimates are still a critical part of market assessment.
Coming to demand, there are various third party sources such as Higher Education Student Data (HESA) which indicates students numbers, country of origin, and term time accommodation figures. These sources do have caveats and downsides, such as HESA data lagging by two years, but when combined together can give a better picture of student demand and demographics in a given city - splits by domicile, degree level, and modes of study. For institutions in England, the Office for Students (OfS) can also provide a more timely assessment of student numbers, albeit this too has its downsides, for example not providing country level splits.
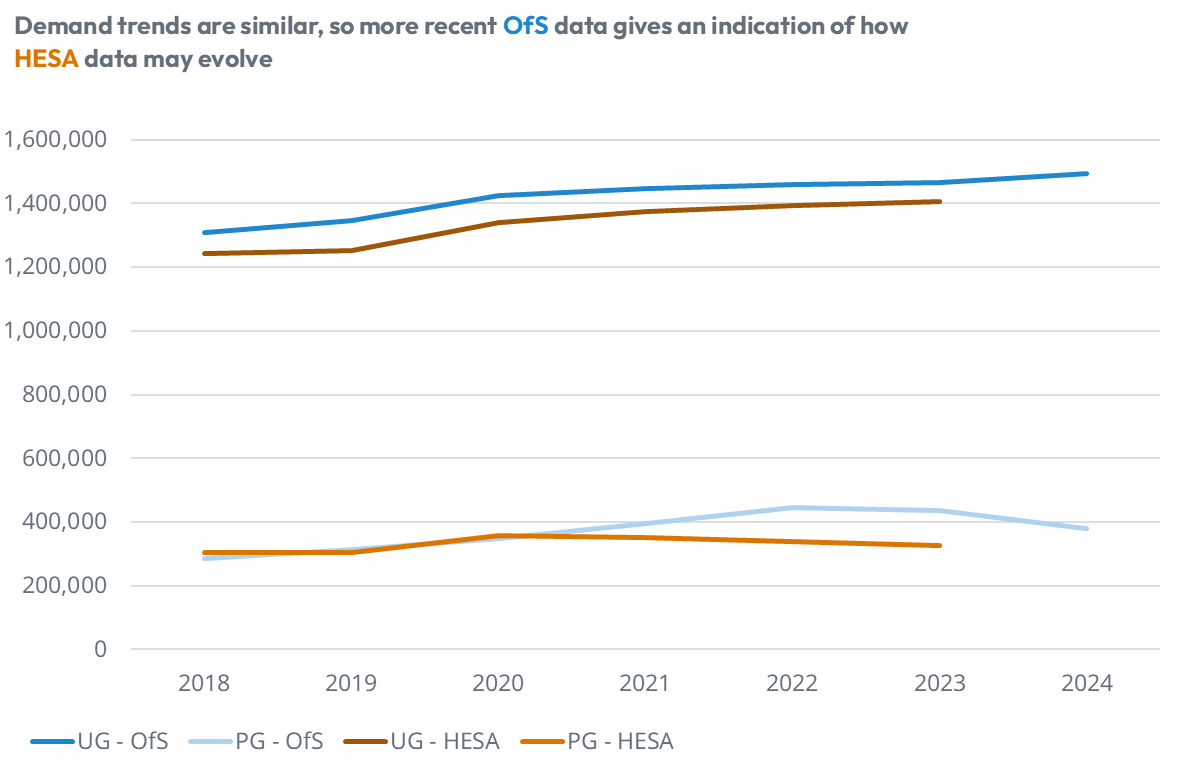
Figure 1: HESA and OfS data - trends are similar, so using both together can provide a more current picture of student numbers
Source: HESA, OfS
Student to Bed Ratios
Student-to-Bed ratios are a commonly used metric, however they are opaque and struggle to accommodate market variations and complexities. One major assumption typically made is that all students in the market (who require accommodation) want to, and can afford to, live in PBSA - this is proven to be false. PBSA is more likely to be taken up by first year students (not in halls), returning international students and postgraduates, plus a smaller number of returning domestic students. SBRs - as a single metric - fail to represent the specific demographics of a market and the resulting obtainable market. Consider two markets which are identical in terms of total supply (student count) and demand (bed count), but both markets have a large difference in domestic/international share - both markets would give the same SBR figure, but the actual demand for different accommodation types such as PBSA would be wildly different. Thus in this case, using SBRs would be incredibly misleading to assess the market situation. Additionally, SBRs are usually only a snapshot in time and contain no information about how fundamentals have changed, or could shift in the future.
Our Supply and Demand Methodology
We believe in a more in-depth, yet easily accessible, approach to market fundamentals and outlook. This is centred around transparent scenario modelling, which considers the following inputs:
- Historic performance
- HMO and PBSA supply
- Demand scenarios
- Demand growth scenarios
- Pipeline delivery scenarios
Using the data sources outlined above for supply and demand, and taking into consideration the above inputs, we provide a view of a market over time for changes in supply and demand. With demand growth scenarios, we take a spread of likely demand growth based on historic undergraduate and postgraduate growth, or from trends seen in more recent data from sources such as University and Colleges Admissions Service (UCAS) and the Office for Students (OfS). As mentioned, future pipeline is considered, however not all applications result in beds entering the market. Whilst the number will continue to evolve, historically ~40% of proposed beds have been delivered, allowing us to more accurately predict future supply growth, whilst being able to amend this input for individual markets.
Two important demand scenarios we consider are ‘total’ demand and ‘core’ demand. We define total demand as all students in the market requiring accommodation, excluding estimates of those living at home. Core demand is calculated as first year students living away from home, returning international undergraduate students, and international postgraduates. While the actual demand will be somewhere between the two, we believe that the latter more accurately reflects actual demand for PBSA in a given market. Further adjustment can also be made to take into account a proportion of returning domestic demand.
Supply and Demand Modelling vs Student-to-Bed Ratios
Taking a look at some example cities, we can see how some of the discrepancies manifest between SBRs and our supply vs demand model. For each of these, we have assumed that 40% of pipeline beds will be delivered in each location.
City 1 - Positive fundamentals and outlook
If we first look at a city where fundamentals are positive, we can see how SBRs can still fall short in telling a full story. In this location, looking at the 2023-24 academic year (most recent year of detailed HESA data), the method to calculate demand can result in a spread in the SBR figures of between ~1.6 and 2.6.

Figure 2: Supply (PBSA beds) vs Demand (students) scenarios for City 1
Source: StuRents
Note: The blue bar represents the total number of PBSA beds. Each yellow dot represents demand for accommodation, based on the methodology stated.
An alternative approach is to use the time series analysis, as outlined previously. Via this method we can see that while ‘core’ demand (first year students living away from home, returning international undergraduate students, and international postgraduates) has been growing faster than supply, this could narrow if demand tends towards a 2-4% growth per annum, resulting in a positive, but more challenging scenario than between the years of 2020-2022 when the spread was wider.. Overall a positive outlook, but the SBR is only a snapshot in time, and still varies widely when considering different demand scenarios. This may be an important consideration for investors looking to longer-term opportunities in a given market where there is potential for the gap between supply and demand to narrow - which is likely to become even more likely if delivery of planned beds is higher.
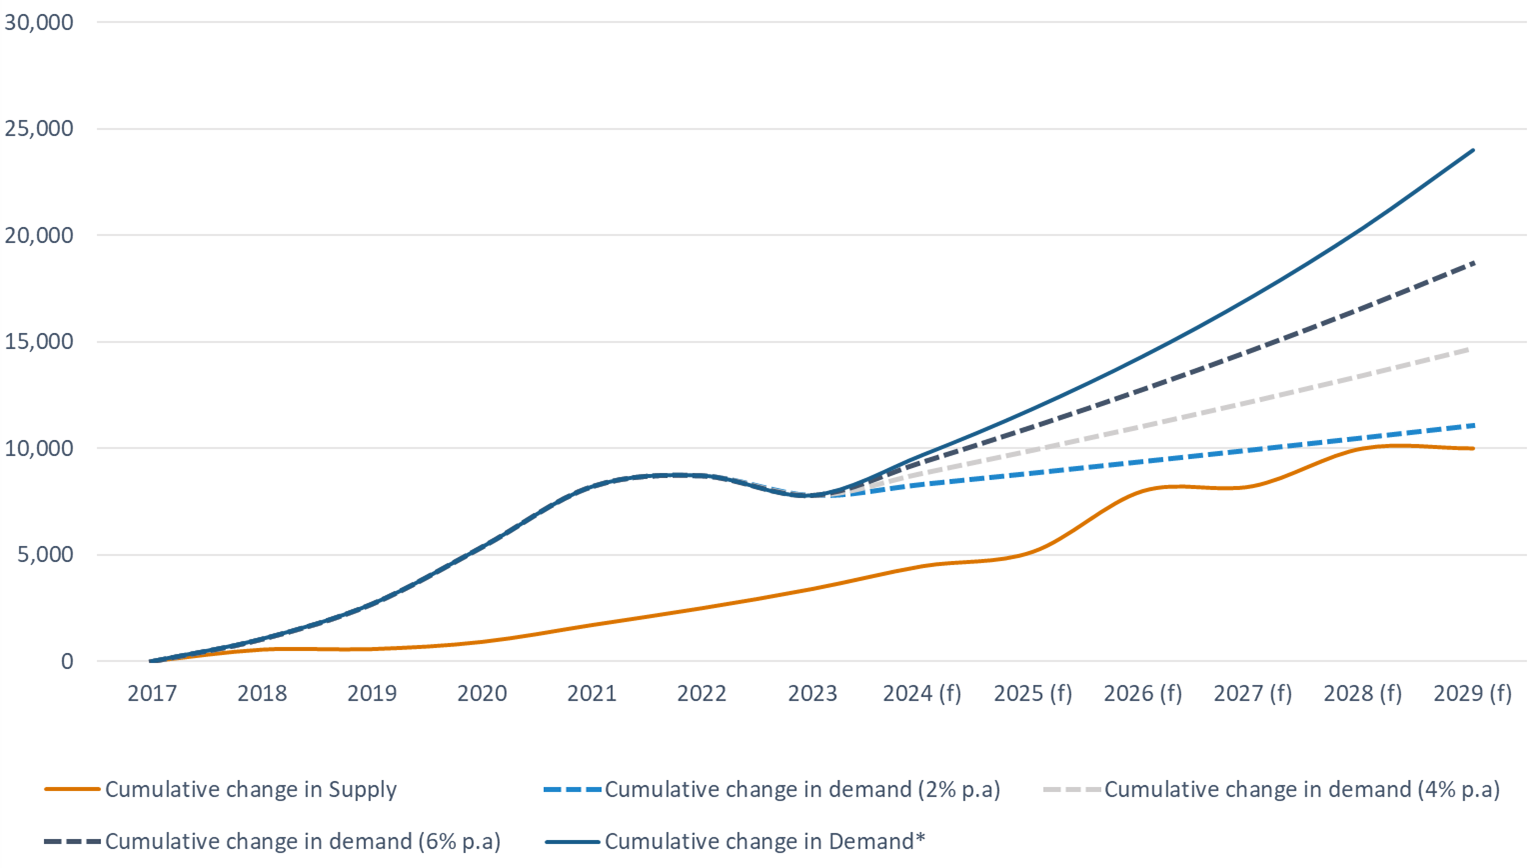
Figure 3: Change in supply and demand since 2017, with scenario projections, for City 1
Source: StuRents
City 2: Supply and demand tracking more closely
If we now look at another city with a positive SBR in the 2023-24 academic year, it would suggest a positive outlook even with a more conservative demand scenario - reinforced by an SBR ranging from ~1.2 to 2. Again, looking at the time-based data and forecasts provides important context and highlights some nuances.
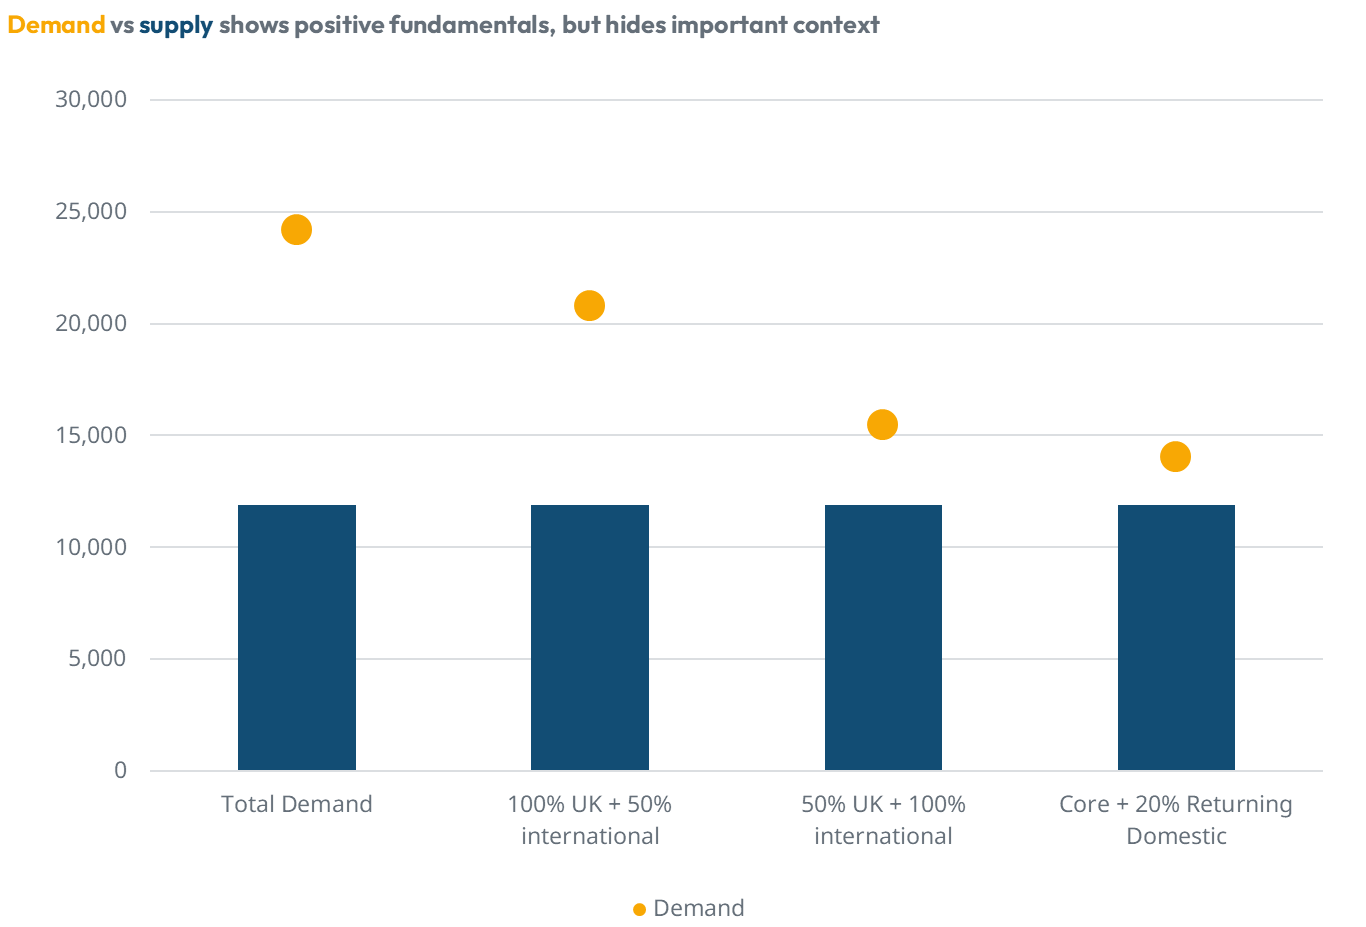
Figure 4: Supply (PBSA beds) vs Demand (students) scenarios for City 2
Source: StuRents
Note: The blue bar represents the total number of PBSA beds. Each yellow dot represents demand for accommodation, based on the methodology stated.
Demand dropped in this location between 2021 and 2022, then rebounded. Looking beyond 2023 and taking the higher growth rate of 6% p.a, demand could begin to outpace supply in the coming years; however if demand growth is on the moderate to low side, demand growth will track or remain below supply growth. This indicates that while an SBR snapshot on the latest data might appear strong, this again hides many nuances and does not provide the necessary context on how the market may change in the future.
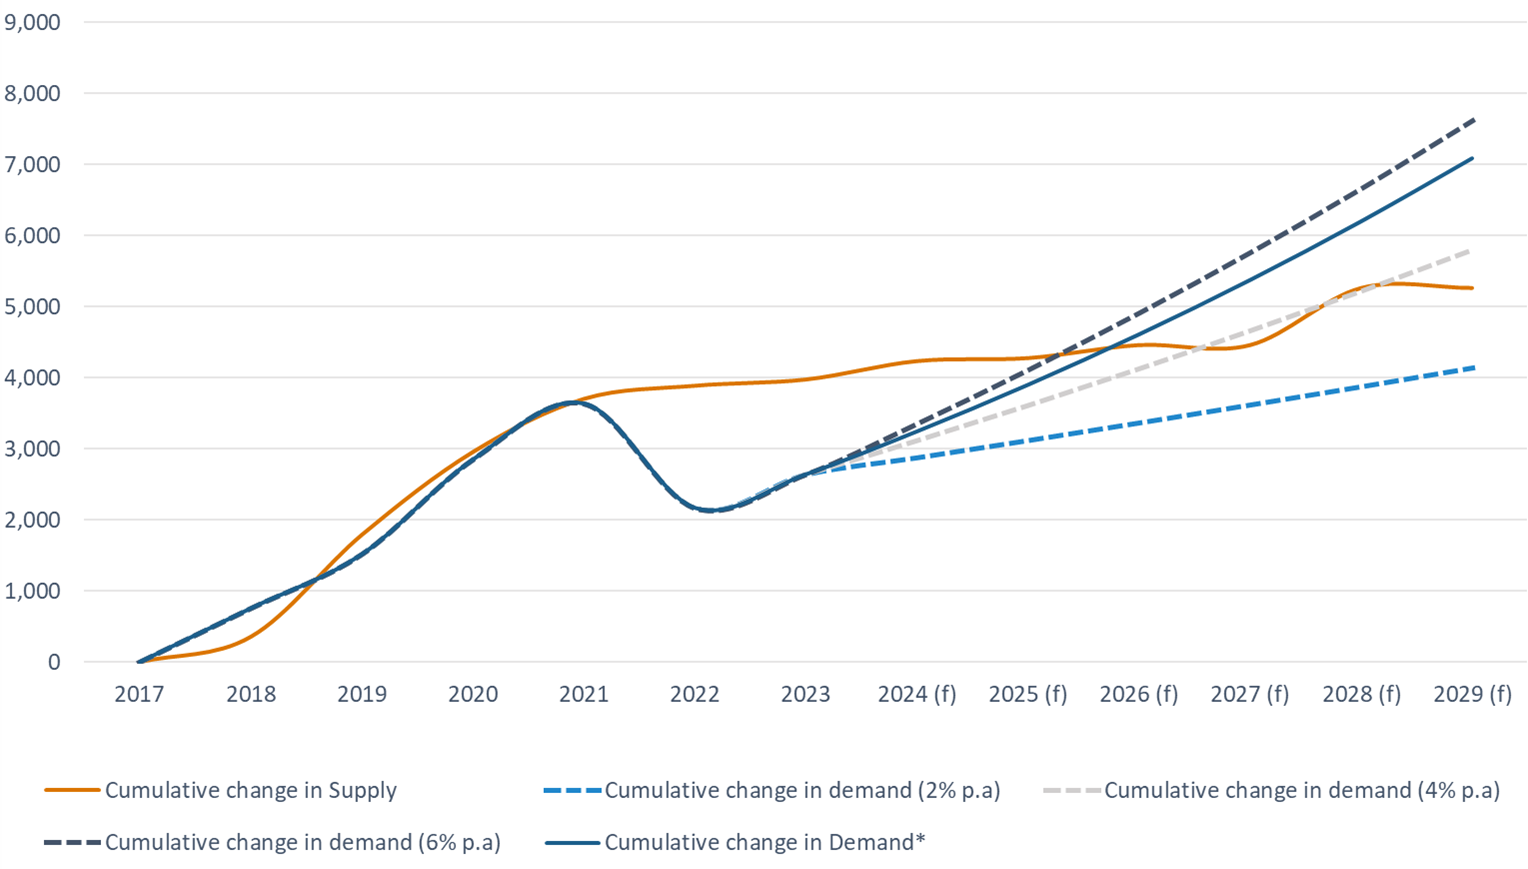
Figure 5: Change in supply and demand since 2017, with scenario projections, for City 2
Source: StuRents
City 3: Supply and demand crossover
Taking another city and applying the same analyses, the 2023-24 SBR snapshot also shows a balanced or positive market even with more conservative assumptions, giving SBRs at ~1.1 to 1.9.

Figure 6: Supply (PBSA beds) vs Demand (students) scenarios for City 3
Source: StuRents
Note: The blue bar represents the total number of PBSA beds. Each yellow dot represents demand for accommodation, based on the methodology stated.
Yet a closer look at the time-based and forecasted data reveals a different picture: after a demand drop in the 2021-2023 period, supply growth crossed over to outstrip increases in demand.
Looking ahead at the forecasted supply and demand, it becomes apparent that supply growth could consistently exceed demand growth for several years, requiring a higher rate of demand growth to absorb this new stock. This underlying trend is not visible from SBRs alone, highlighting how headline metrics can obscure long-term risks or opportunities.

Figure 7: Change in supply and demand since 2017, with scenario projections, for City 3
Source: StuRents
The impact of these changing fundamentals is further reinforced by our Occupancy Survey data, where leasing velocity in this location is down both year on year, and compared to the national average.
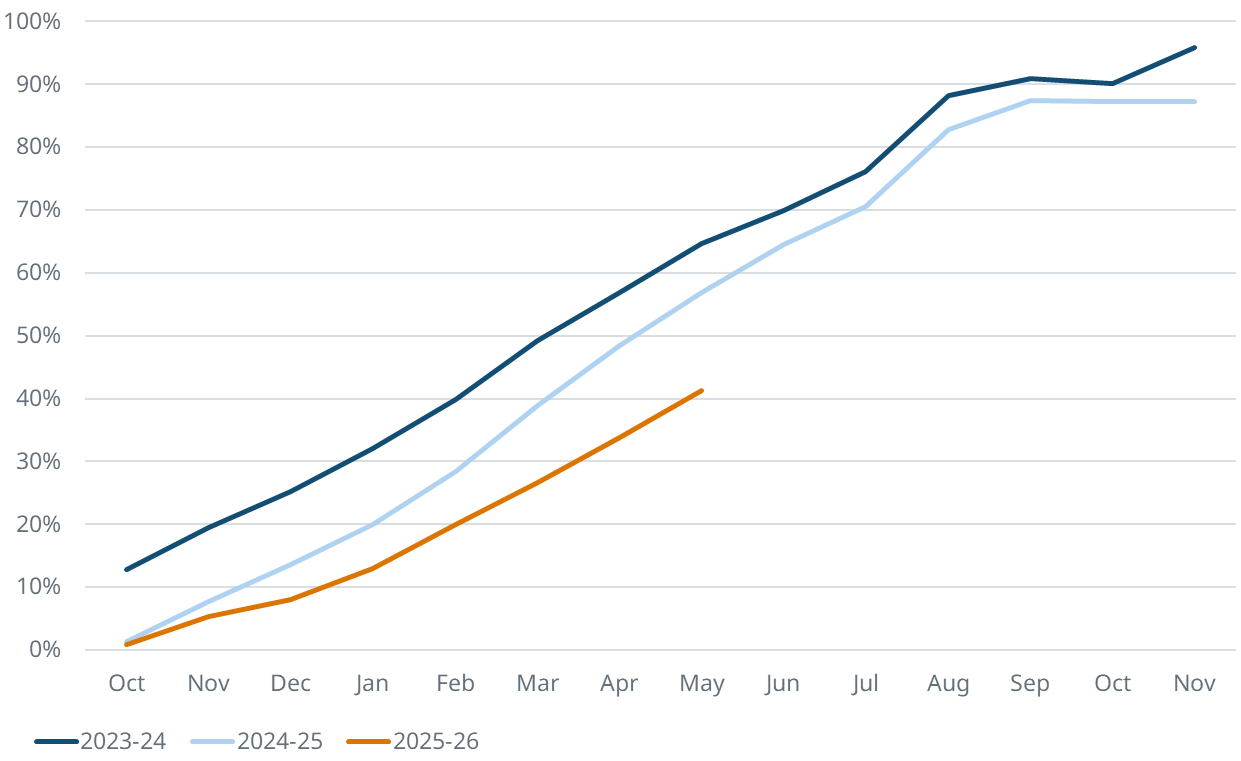
Figure 8: Leasing velocity for City 3
Source: StuRents Occupancy Survey
Summary
When assessing the student accommodation market, comparing supply and demand growth over time provides a more balanced and realistic appraisal than relying on a single headline metric. Scenario-based analysis, such as exploring outcomes under high or low student growth or varying levels of pipeline delivery, offers valuable insight into potential risks and opportunities. Market performance and outlook using this method also closely matches observed trends in rents and occupancy, even in locations where SBRs give a positive impression, further solidifying the potential of this approach.
For more information about our proprietary, highly granular data covering UK student accommodation contact the StuRents Research team today. Book a demo of our Data Portal to find out how you can have up-to-the-minute university housing insights at your fingertips, or get in touch with us about our Occupancy Survey.
Share

Article by
Research Analyst at StuRents
David Reader is a research analyst in StuRents’ research division, StuRents Intelligence.
