
UCAS clearing 2025 - 15 days after results day

15 days on from A-Level Results Day on the 14th of August, StuRents has examined the latest available undergraduate acceptance data from UCAS to highlight key trends and notable year-on-year (YoY) changes. Bear in mind that these figures will continue to evolve, with a final dataset expected from UCAS 28 days after results day, on the 11th of September.
Source: UCAS
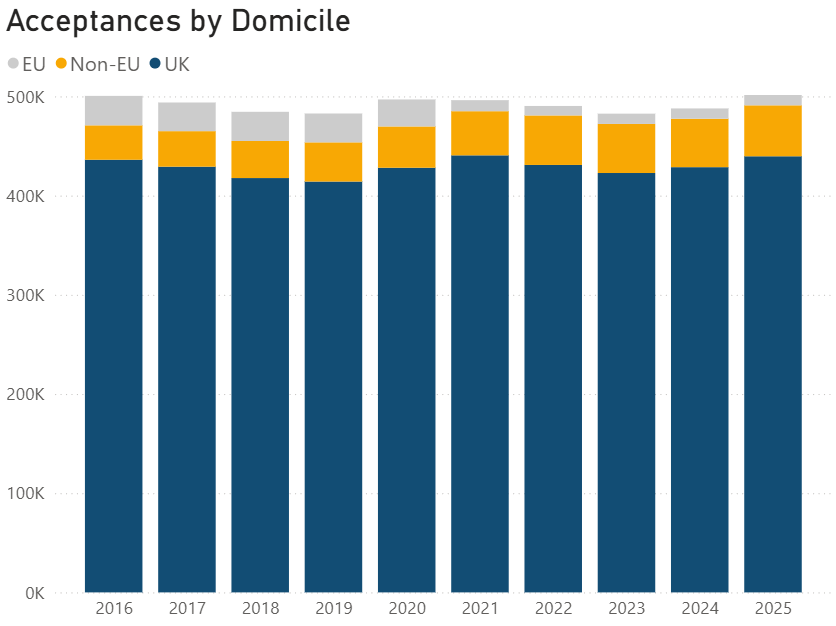
Overall, acceptances are up 2.8% YoY, with the total figure breaking the 500k mark for the first time (at this point in the cycle) since 2016. Acceptances from UK students are up 2.6% YoY, while those from the EU have flatlined at ~10k - representing just 2.1% of the total. International acceptances from non-EU domiciled students have increased by 5.2% YoY, representing 10.2% of the total.
Source: UCAS
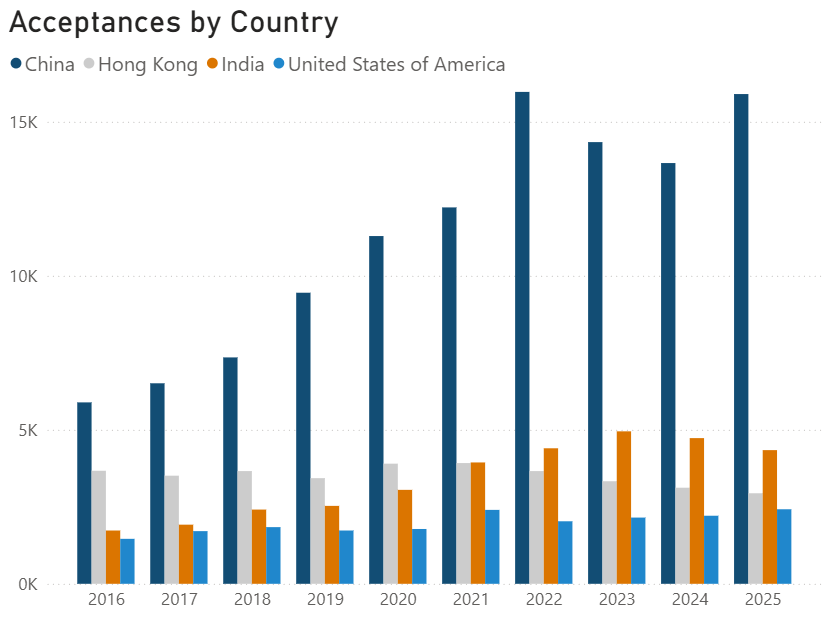
Breaking those non-EU acceptances down by country, there are a few noteworthy trends. Chinese acceptances are up 16.4% YoY, all but equalling 2022’s peak of 15,970 after two years of decline. These acceptances from China represent 31% of the Non-EU total. Indian acceptances have decreased for the second year in a row, down 8.2% YoY to 4,300. However, the 10-year general trend has been one of growth. Numbers from Hong Kong are also down YoY - and for the fourth year in a row. The current figure of 2,940 is the lowest recorded since before 2016. Acceptances from the US are up by 9.5% YoY, just eclipsing the peak of 2,400 seen in 2021 - a trend some may argue as being evidence of the ‘Trump effect’.
Source: UCAS
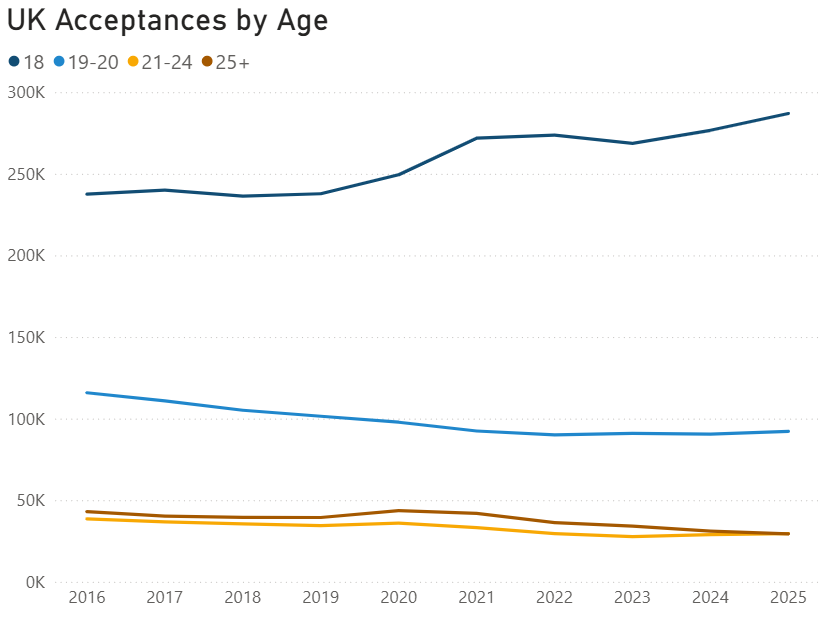
Looking at UK acceptances by age group, the trends are clear. 18-year-old acceptances are up by 3.7%, continuing the general growth pattern. 18-year-olds now represent just over 65% of all UK acceptances, the highest this proportion has been in this 10-year period. While the 19-20 group have increased by 2% YoY, the trend since 2016 has been one of decline. The same can be said for the more mature age groups of 21-24 and the over 25s.
Source: UCAS
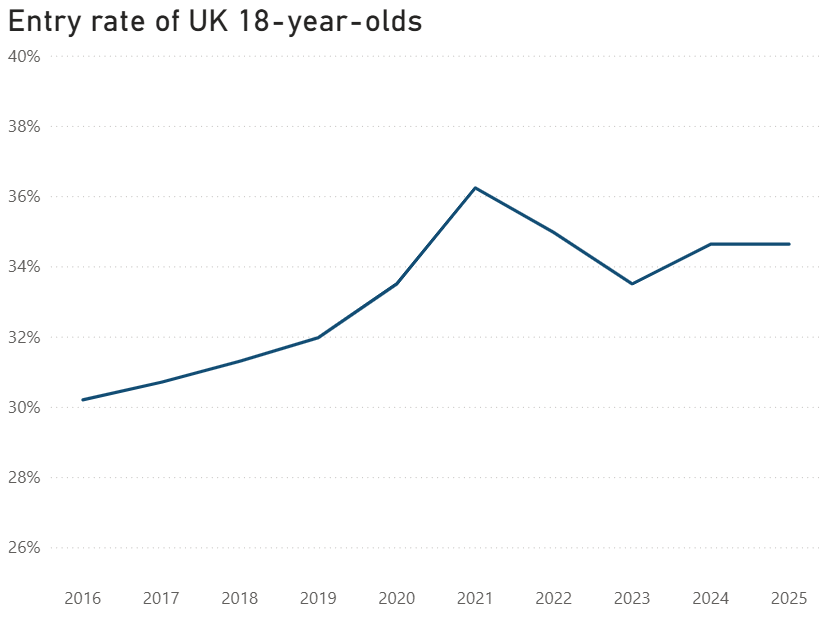
While acceptances from UK 18-year-olds are up, the proportion of the UK 18-year-old population that are accepting places on undergraduate courses is unchanged YoY. After significant growth between 2016 and 2021, this entry rate took a post-covid hit, however has been on a general upward trend in the years since then.
Source: UCAS
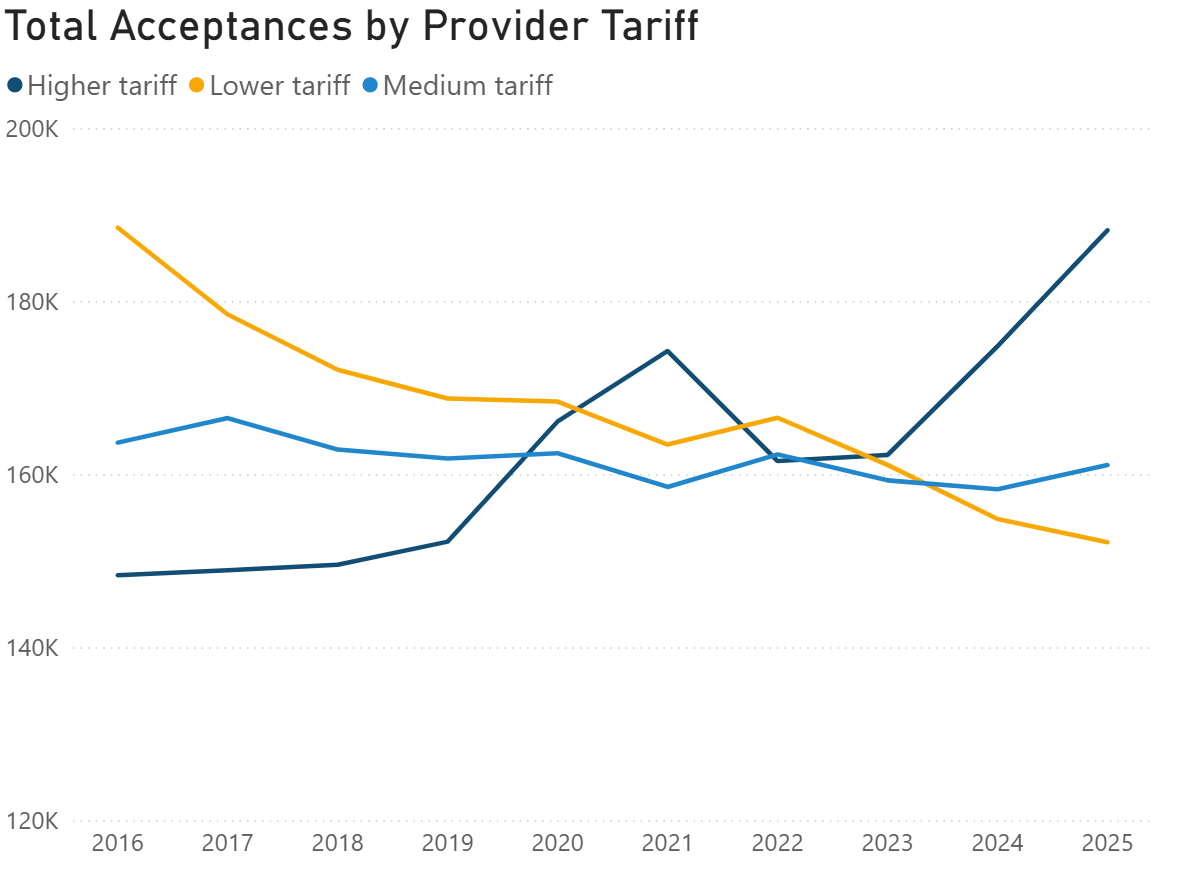
Switching our attention to acceptances by provider tariff (how high the university’s entry requirements are), the type of institution students are tending to choose becomes apparent. Across all undergraduates, higher tariff acceptances are up by 7.7% YoY, representing 37.5% of the total. Lower tariff acceptances have been on a long downward trend, now starkly contrasting the position they were in back in 2016. Medium tariff acceptances have fluctuated, albeit on a general downward trend as well.
Source: UCAS
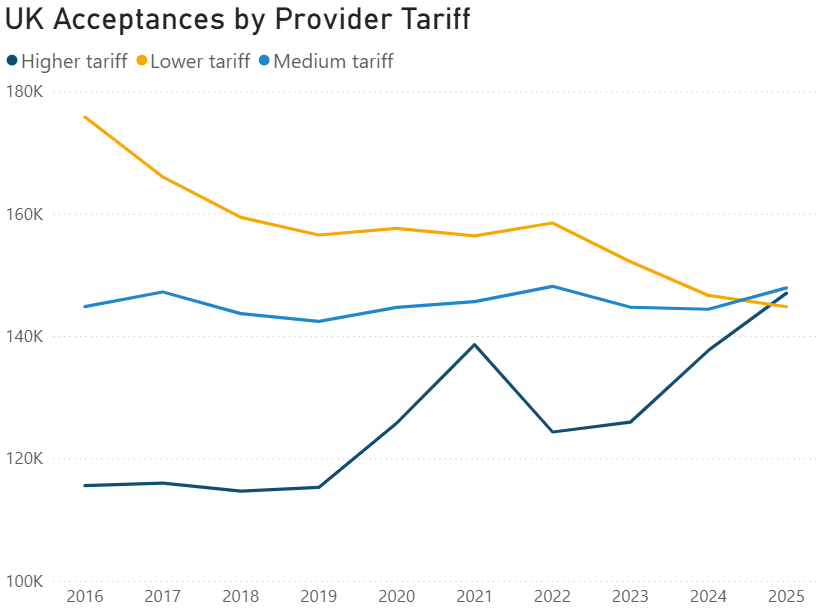
Looking at the provider tariff of just UK acceptances, there is a clear flight-to-quality trend. While lower and medium tariff providers used to dominate, both have been in decline while higher tariff acceptances have been increasing. Higher tariff provider acceptances are up 6.8% YoY, and now all three groups have roughly an equal share of the UK undergraduate student population.
Source: UCAS
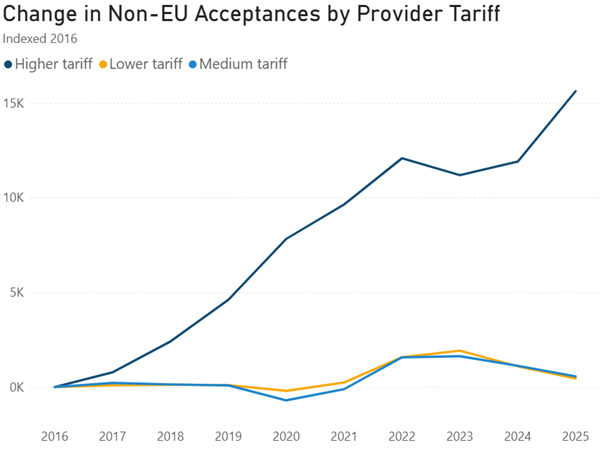
The chart above shows how non-EU acceptances have changed since 2016, broken down by provider tariff. As of 2025, higher tariff acceptances have increased by over 15,000, while lower and medium tariff acceptances have more or less stagnated. This highlights that although demand from international students is growing, it is largely concentrated among more prestigious universities.
Source: UCAS
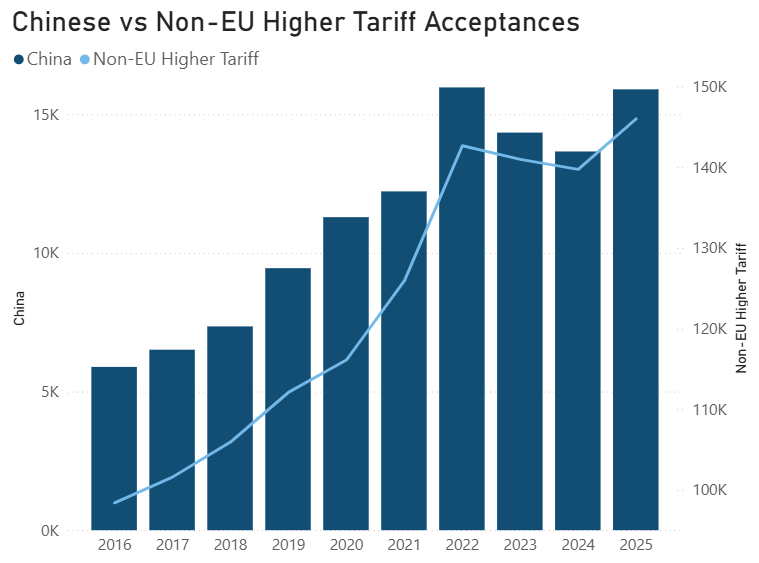
Overlaying Chinese acceptances with non-EU higher-tariff acceptances reveals closely aligned patterns, highlighting both the dominance of Chinese students within the UK international student body and their strong preference for elite institutions.
In summary, the 2025 UCAS acceptance data so far shows a modest overall rise in undergraduate acceptances, driven largely by growth among UK 18-year-olds and a rebound in non-EU international demand - particularly from China. While Indian and Hong Kong numbers have softened, strong Chinese and US growth has helped push international numbers upward, with an increasingly heavy concentration in higher tariff universities. The data also underscores a broader ‘flight-to-quality’ trend, as both UK and international students increasingly favour more selective institutions, while lower and medium tariff providers continue to see declines. The StuRents research team will share an update once the final 28-days-after-results-day dataset has been released.
For more information about our proprietary, highly granular data covering UK student accommodation contact the StuRents Research team today. Book a demo of our Data Portal to find out how you can have up-to-the-minute university housing insights at your fingertips, or get in touch with us about our Occupancy Survey.
Share

Article by
Research Analyst at StuRents
Sam Gillespie is a research analyst in StuRents’ research division, StuRents Intelligence.
