
September Occupancy Update

Image courtesy of Flickr
So, was the 2025-26 PBSA letting cycle just slow or genuinely low?
The answer - a bit of both.
Here, we provide an update on how the market performed during the business end of the season, revealing year-on-year differences, cluster vs studio seasonality and locational variance.
StuRents Occupancy Survey includes private PBSA direct-let bookings only. University halls and private beds on nomination agreements are excluded.
Source: StuRents Occupancy Survey
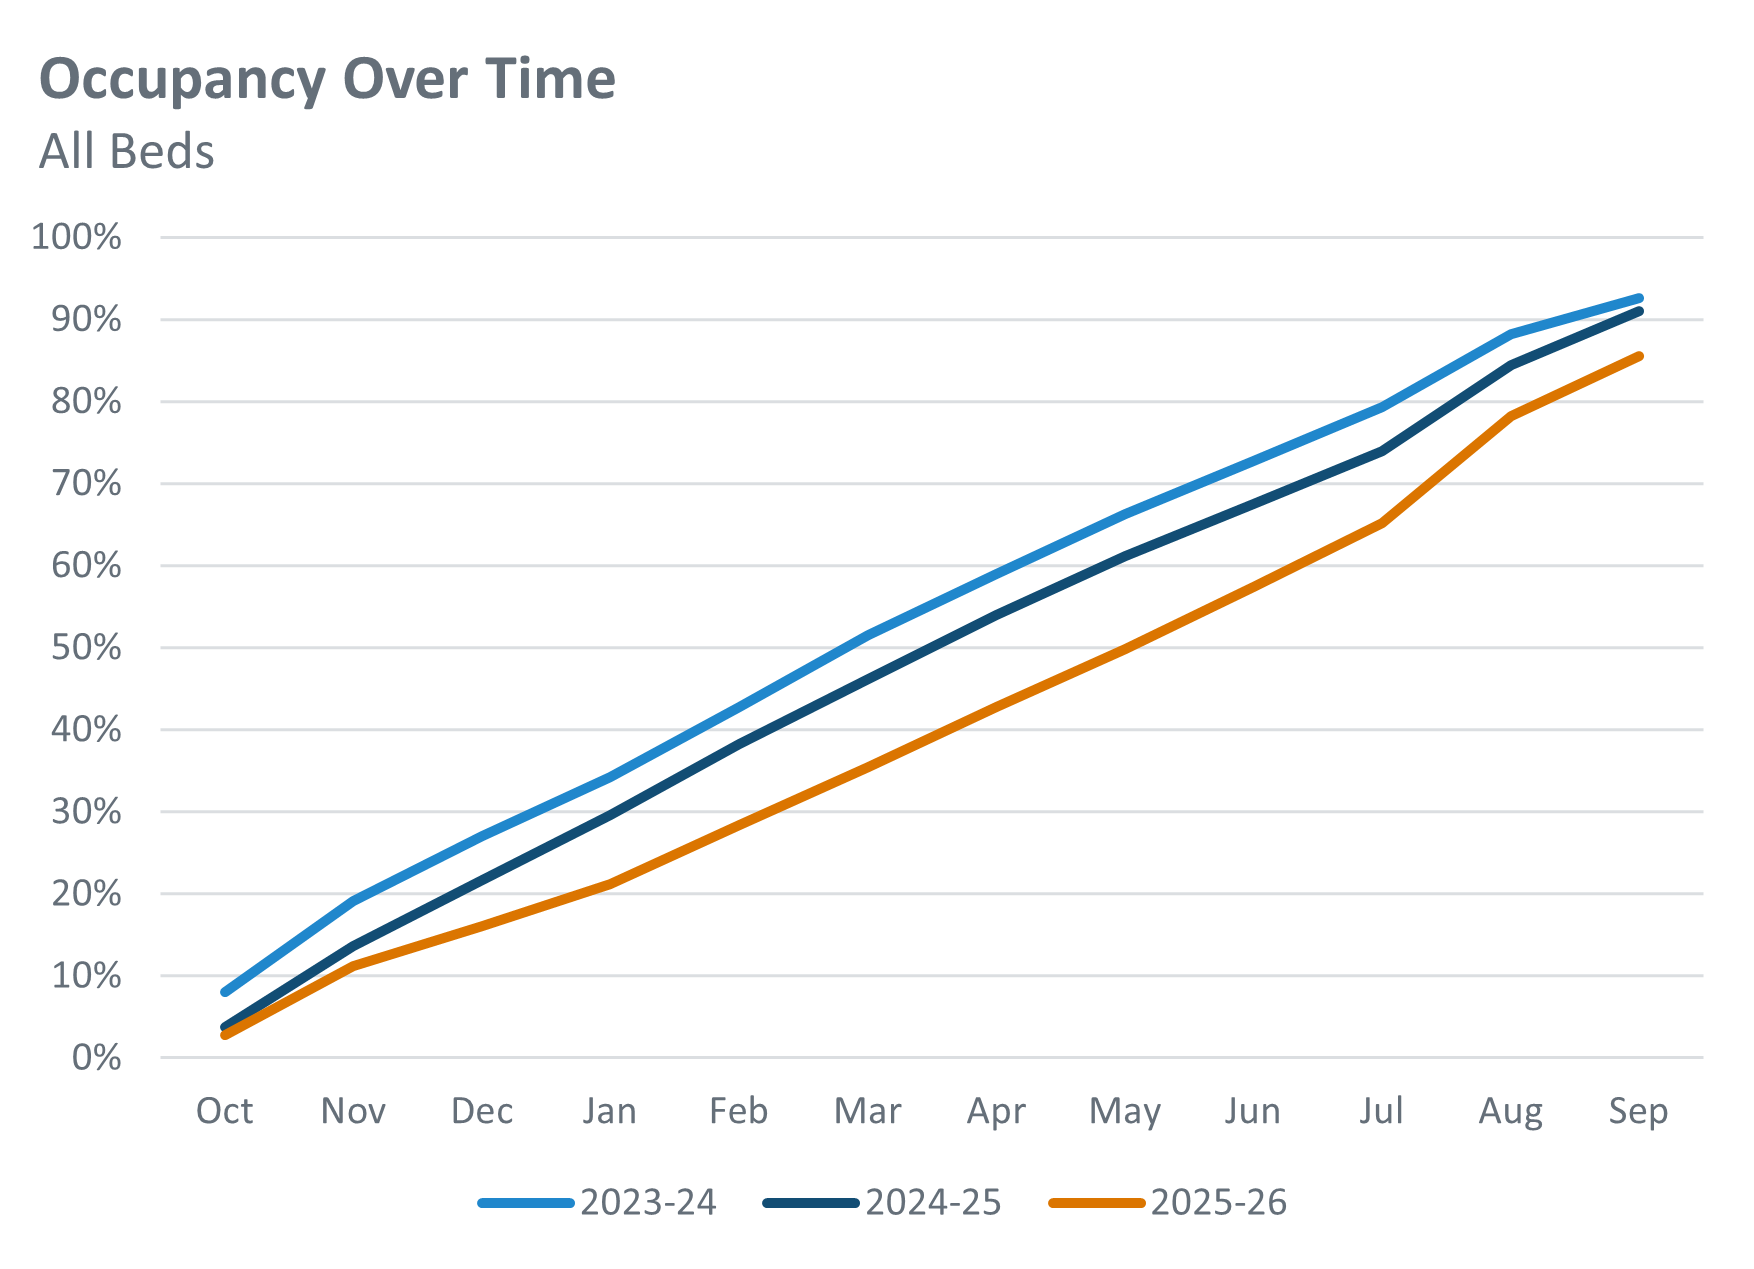
The above chart shows how 25-26 leasing velocity consistently lagged behind that of the two previous years. While bookings picked up considerably in the summer months, it wasn’t enough to close the gap. Across all bed-types in all 25 locations we cover, average occupancy stood at 85.6% as of the end of September. This represents a 5.4 percentage point drop in occupancy year-on-year (YoY).
Source: StuRents Occupancy Survey
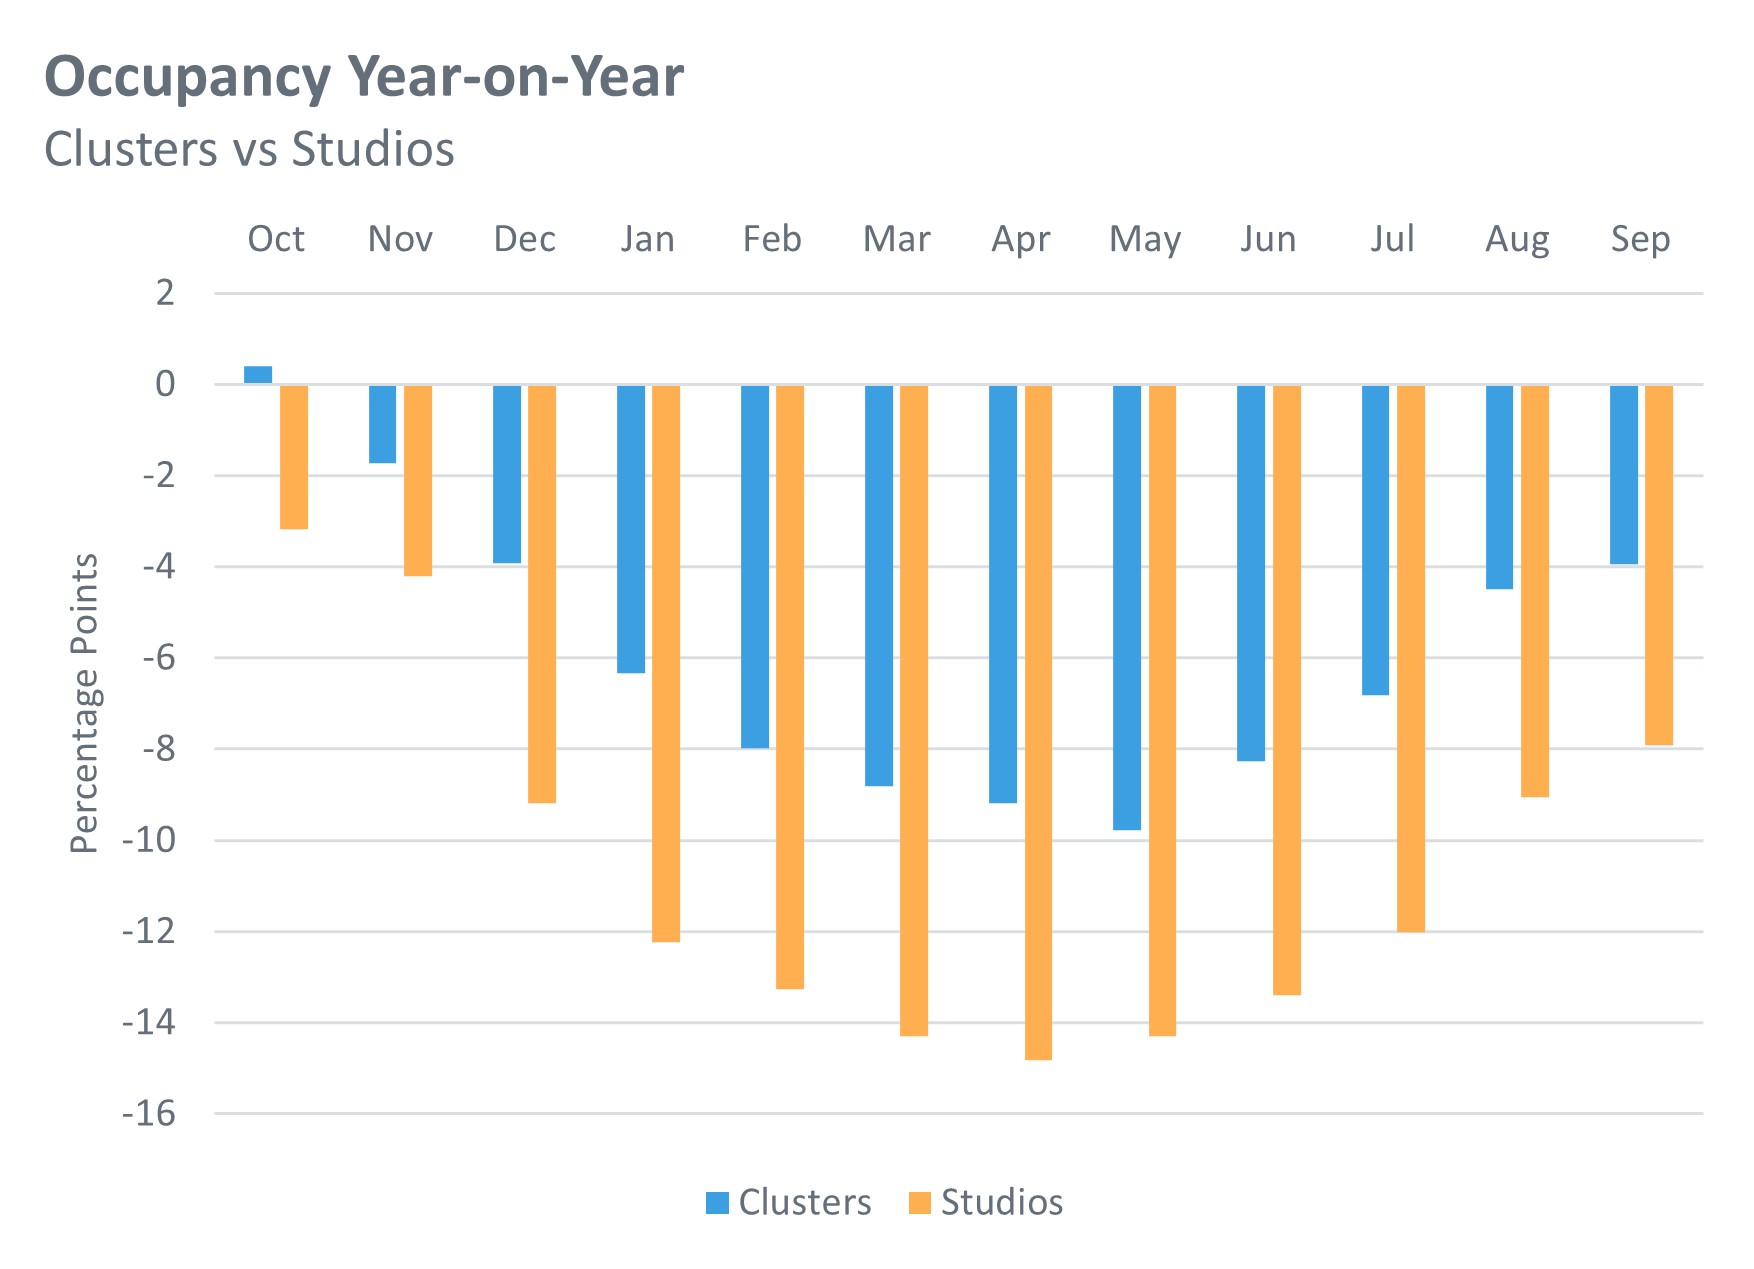
The above is showing how the YoY gap in bookings has changed throughout the cycle, for both cluster beds and studios. Clusters hit a low point of 9.8 points down in May, while studios’ nadir came a month earlier in April - down 14.8 points vs the same point in the 24-25 cycle. Both bed types increased in velocity during the summer, with clusters finishing 3.9 points down YoY and studios finishing 7.9 points down YoY.
Source: StuRents Occupancy Survey
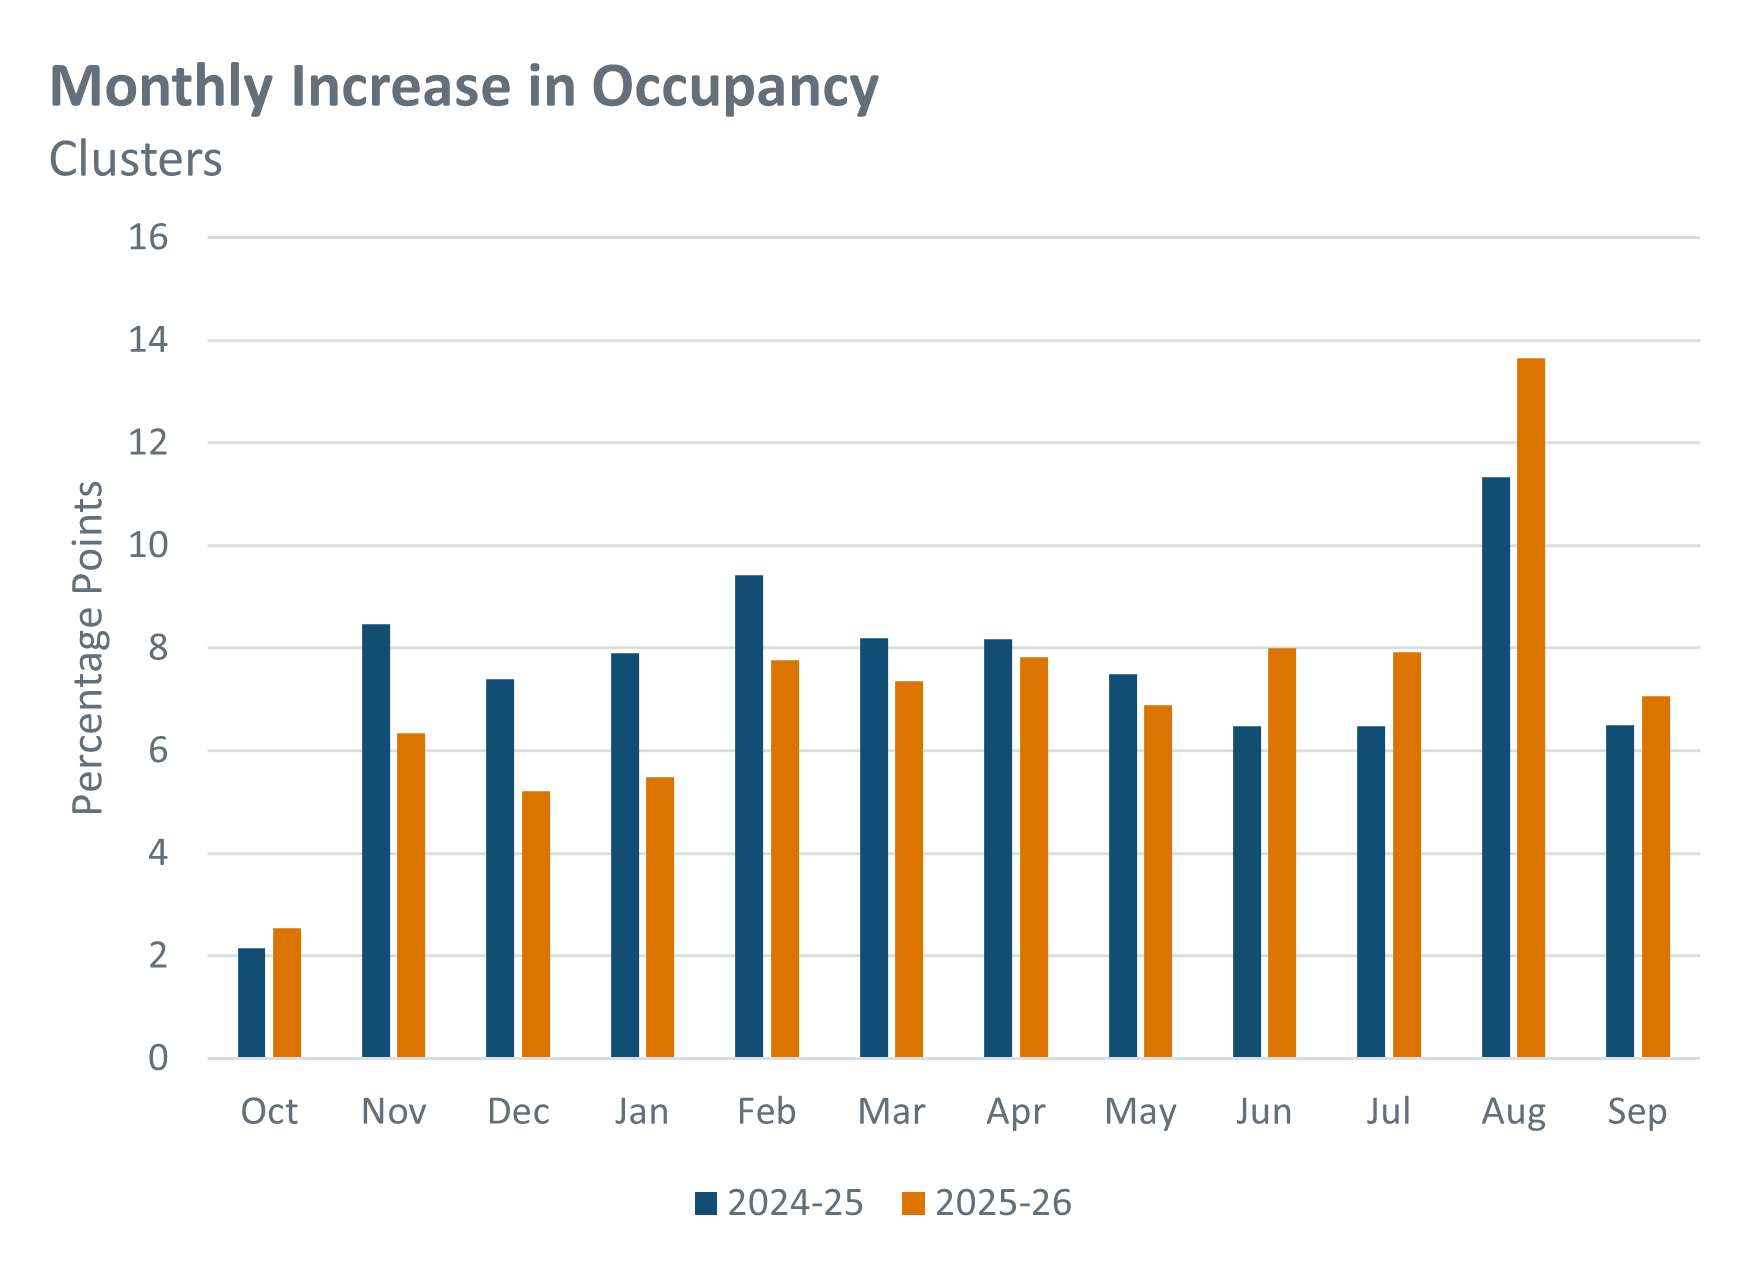
Looking at which months of the cycle have had the biggest gains in cluster occupancy, the chart above shows that bookings were particularly slow in the early months. Things then picked up between February and July before a not unexpected but significant bumper month in August, during which 13.6% of beds were booked. This somewhat contrasts last year, where a larger proportion of clusters were booked in the earlier months, albeit with a similar but not as large spike in August. This points towards a change in behaviour of students, with more choosing to book later than in previous years.
Source: StuRents Occupancy Survey
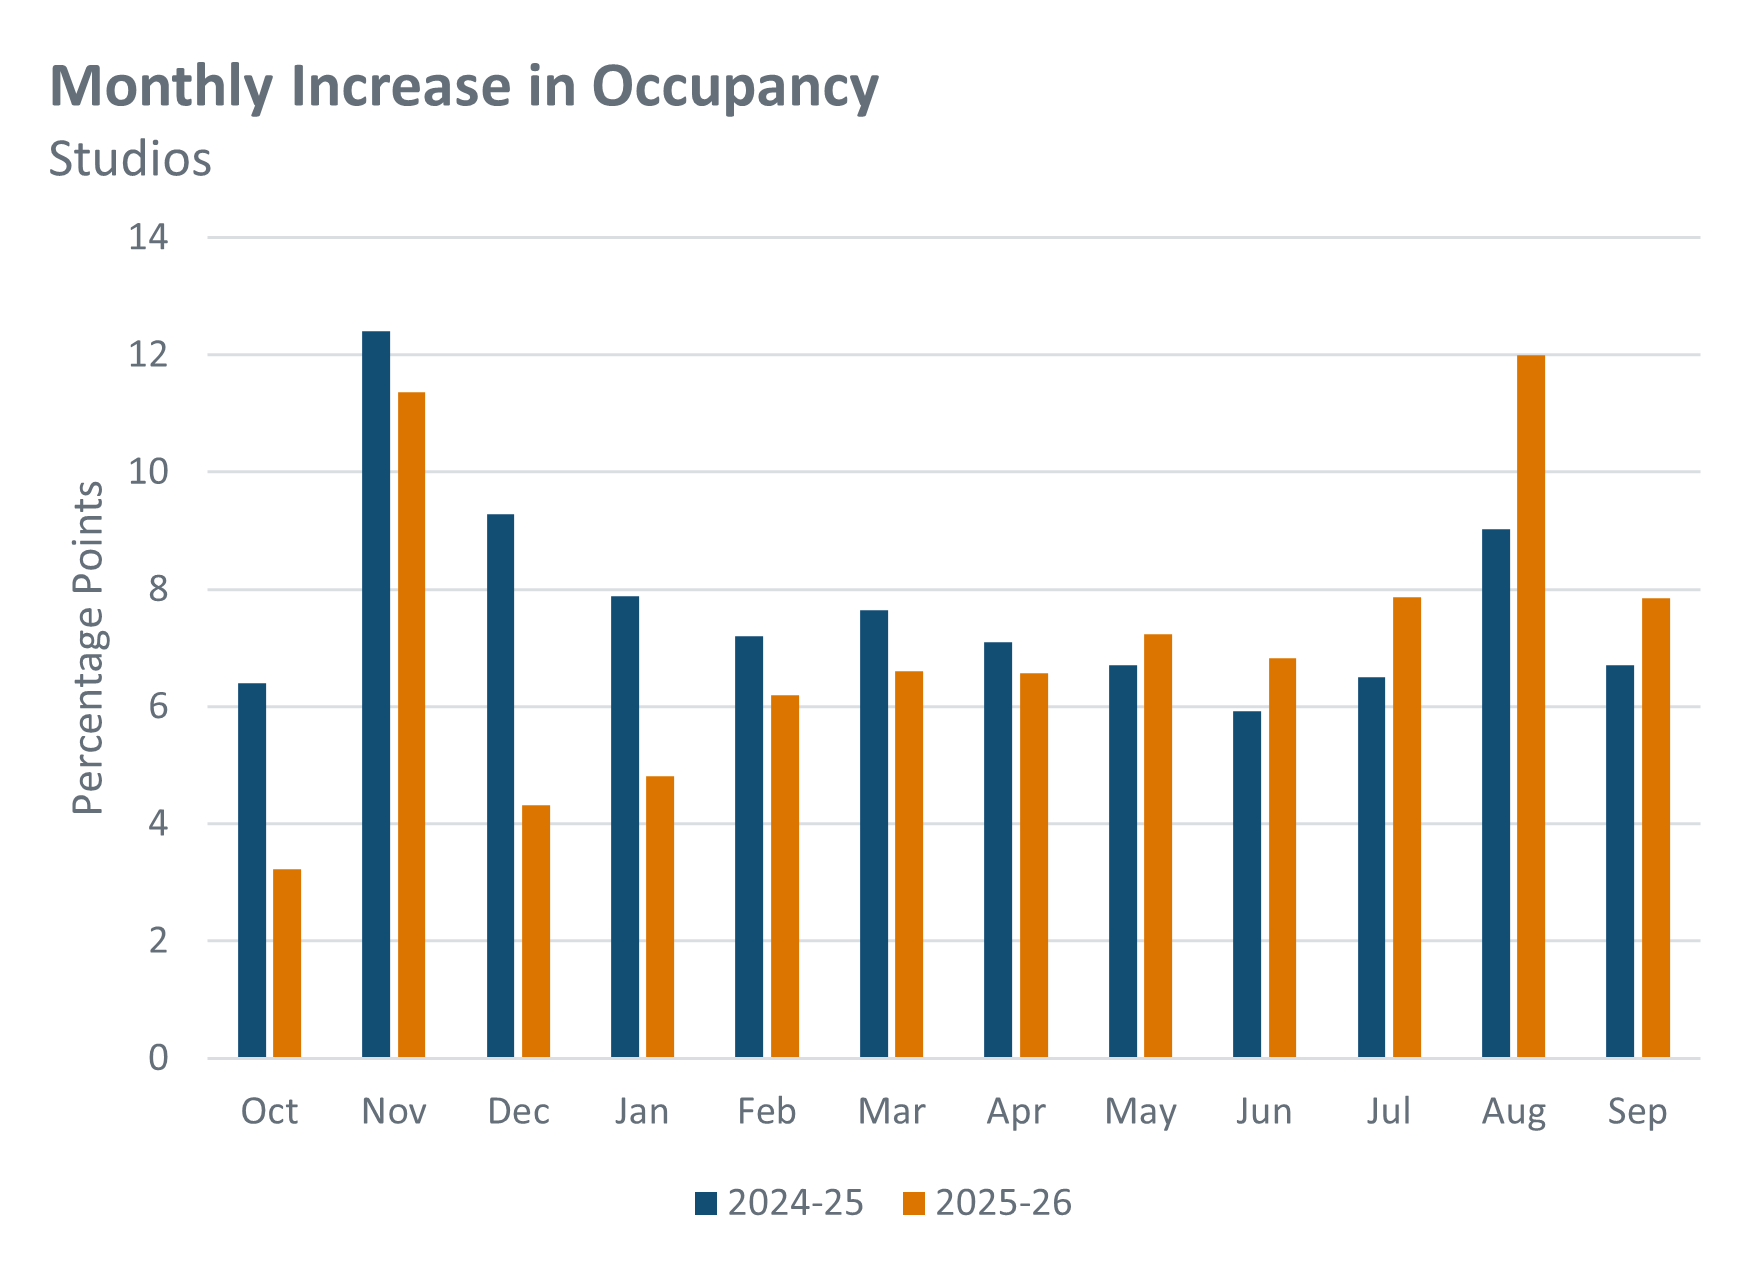
Looking at the same chart but for studios, the shift in seasonality is more obvious. While in the 24-25 cycle bookings started strongly before decreasing over time (until the summer), the opposite was true for 25-26. After the November spike, bookings dropped off considerably before climbing steadily up until the August flurry - during which 12% of studios were booked. This again reinforces the idea that student behaviour has shifted to a later-in-the-cycle pattern.
Source: StuRents Occupancy Survey
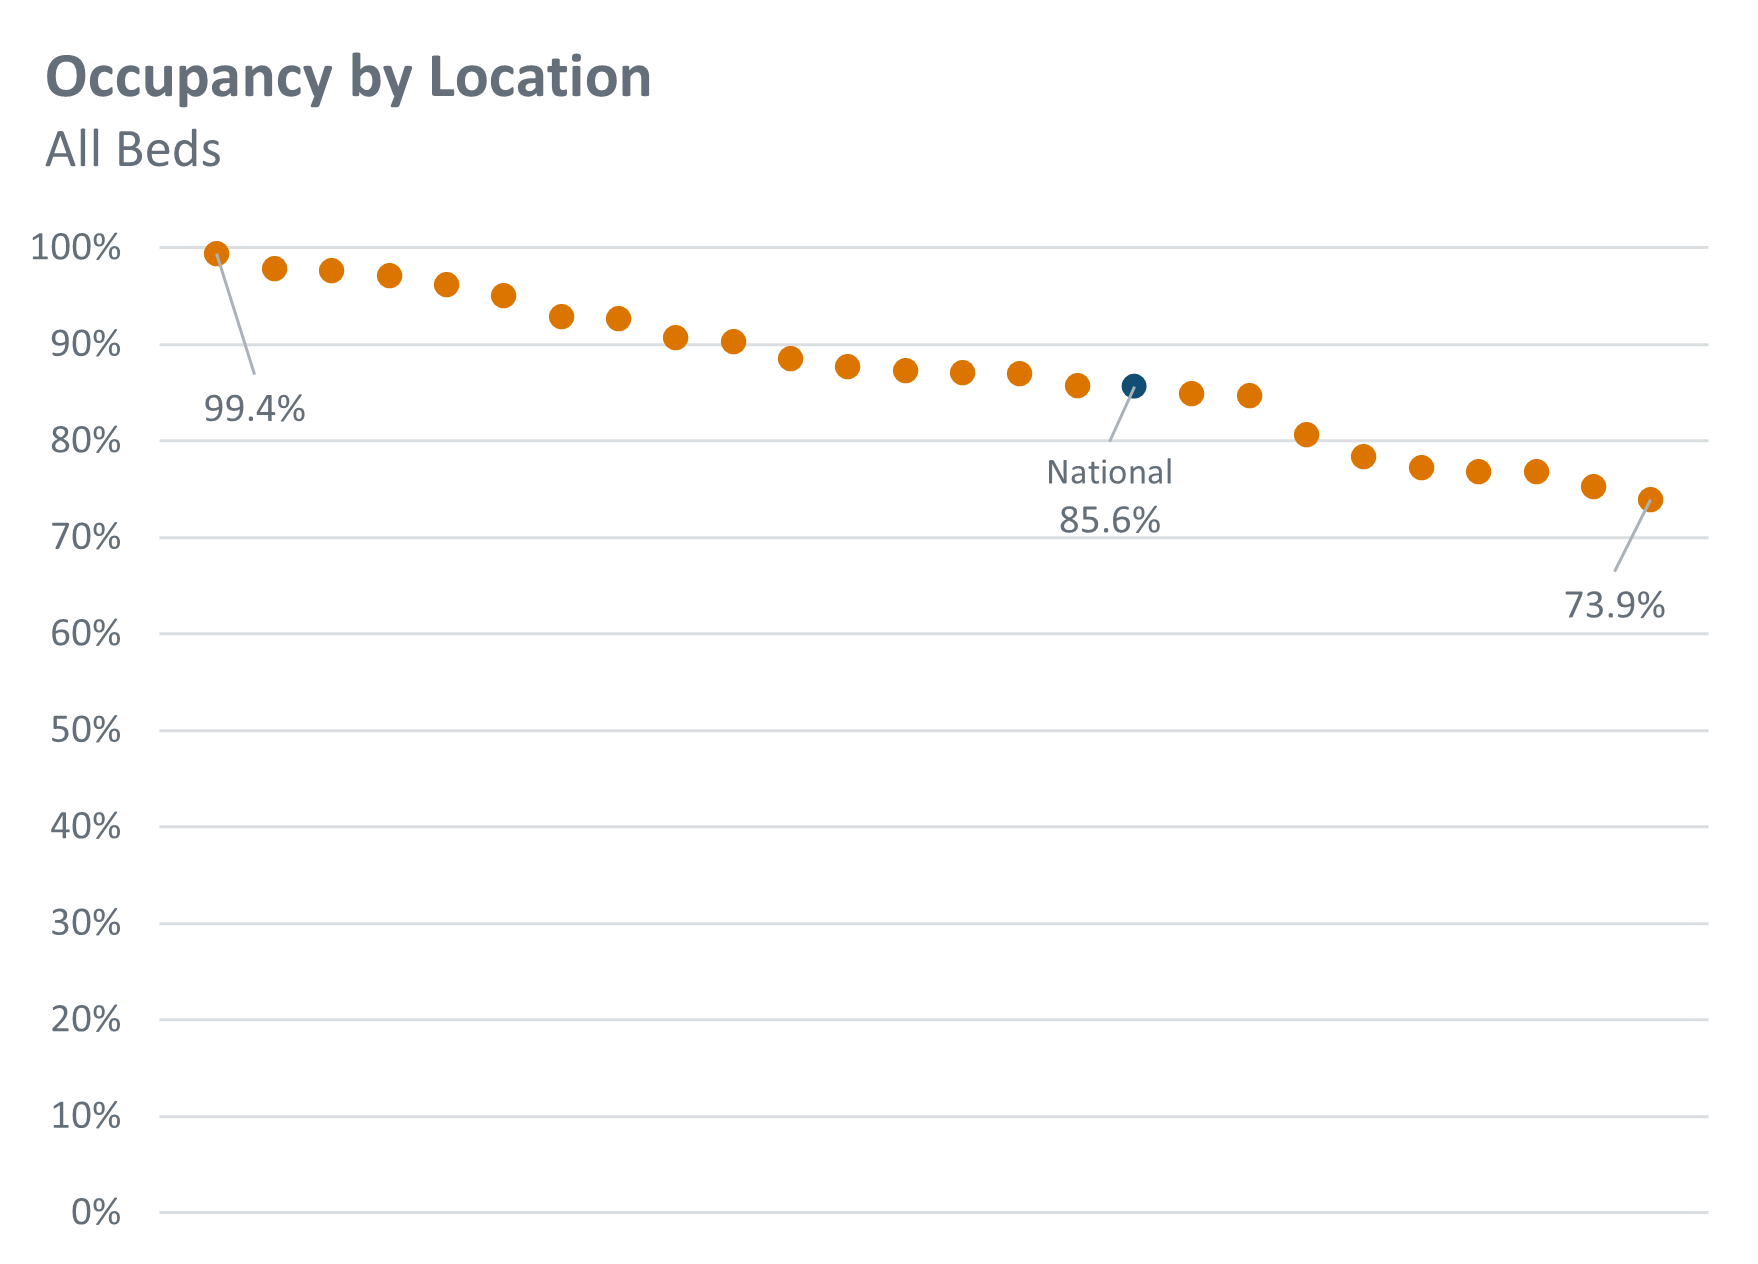
The above chart shows how end-of-September occupancy varies across the 25 locations we cover in the survey, including the national average for comparison. The difference in fortunes is stark, with the highest performing location recording 99.4% occupancy, compared to 73.9% for the lowest. This highlights just how varied the supply and demand dynamics are in different locations across the UK.
In summary, the 2025-26 PBSA letting cycle was both slower and lower than previous years. While demand eventually strengthened over the summer, it wasn’t enough to offset the sluggish start, leading to an overall decline in occupancy. The data suggests a clear shift in student booking behaviour, with more opting to commit later in the cycle. Performance also varied significantly by location, underscoring the importance of local market dynamics in shaping outcomes. These trends point towards a return to occupancy levels seen before the post-Covid boom, but whether this is the new normal remains to be seen.
Roll on 2026-27!
For more information about our proprietary, highly granular data covering UK student accommodation contact the StuRents Research team today. Book a demo of our Data Portal to find out how you can have up-to-the-minute university housing insights at your fingertips, or get in touch with us about our Occupancy Survey.
Share

Article by
Research Analyst at StuRents
Sam Gillespie is a research analyst in StuRents’ research division, StuRents Intelligence.
