
Occupancy Update – July 2026

We are now very much in the throes of the crucial summer months of the PBSA leasing cycle, and this update explores how the market has progressed through the end of July, analysing booking trends, year-on-year performance, and seasonal patterns by bed type.
The Occupancy Survey continues to provide the most comprehensive view of UK PBSA leasing activity available, now actively surveying more than 600 sites and offering valuable insight into current dynamics across all major student accommodation markets.
StuRents Occupancy Survey includes private PBSA direct-let bookings only. University halls and private beds on nomination agreements are excluded.
Source: StuRents Occupancy Survey
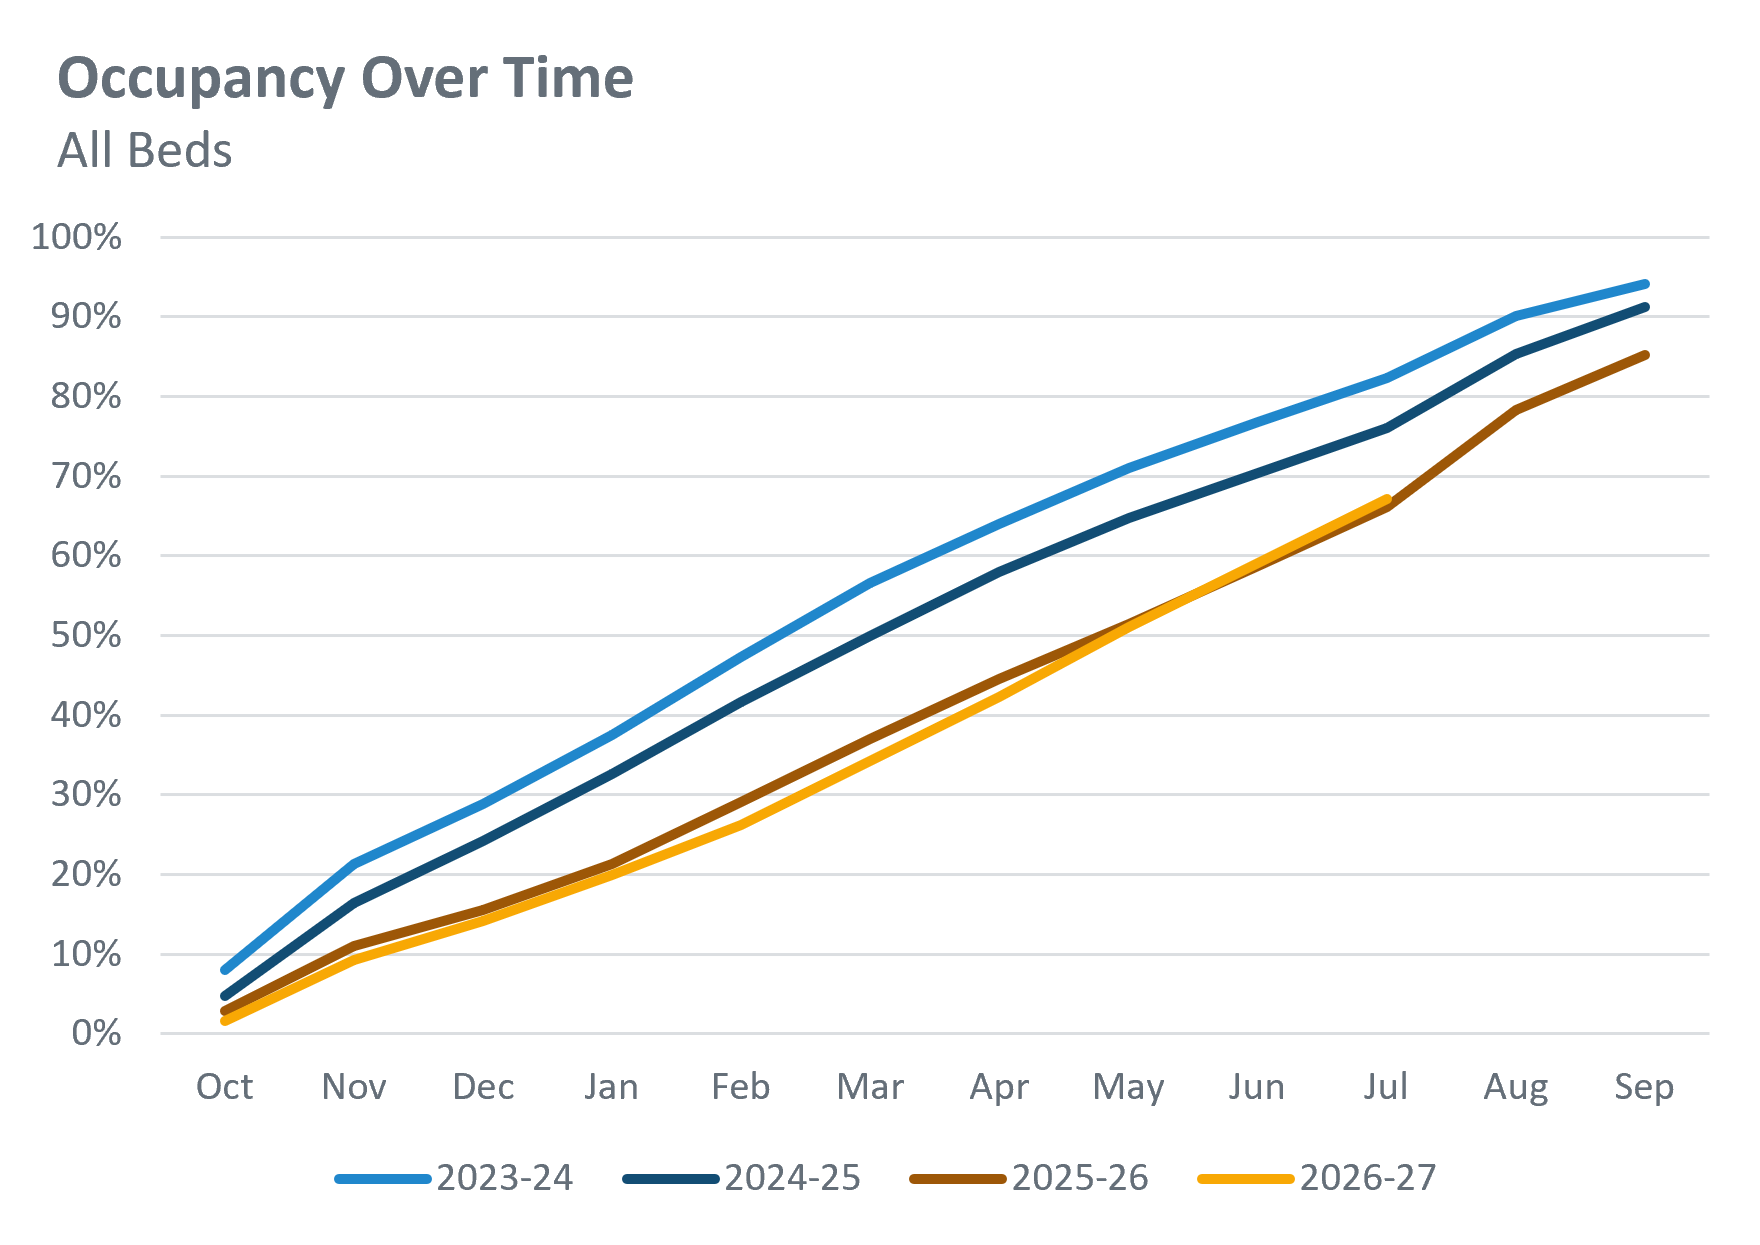
The above is showing how 26-27 is continuing to track closely with that of 25-26, and is now slightly ahead year-on-year (YoY). Across all bed types in all 28 locations we cover, average occupancy for 26-27 stood at 67.1% as of the end of July. This represents a 1.0 percentage point increase YoY.
Source: StuRents Occupancy Survey
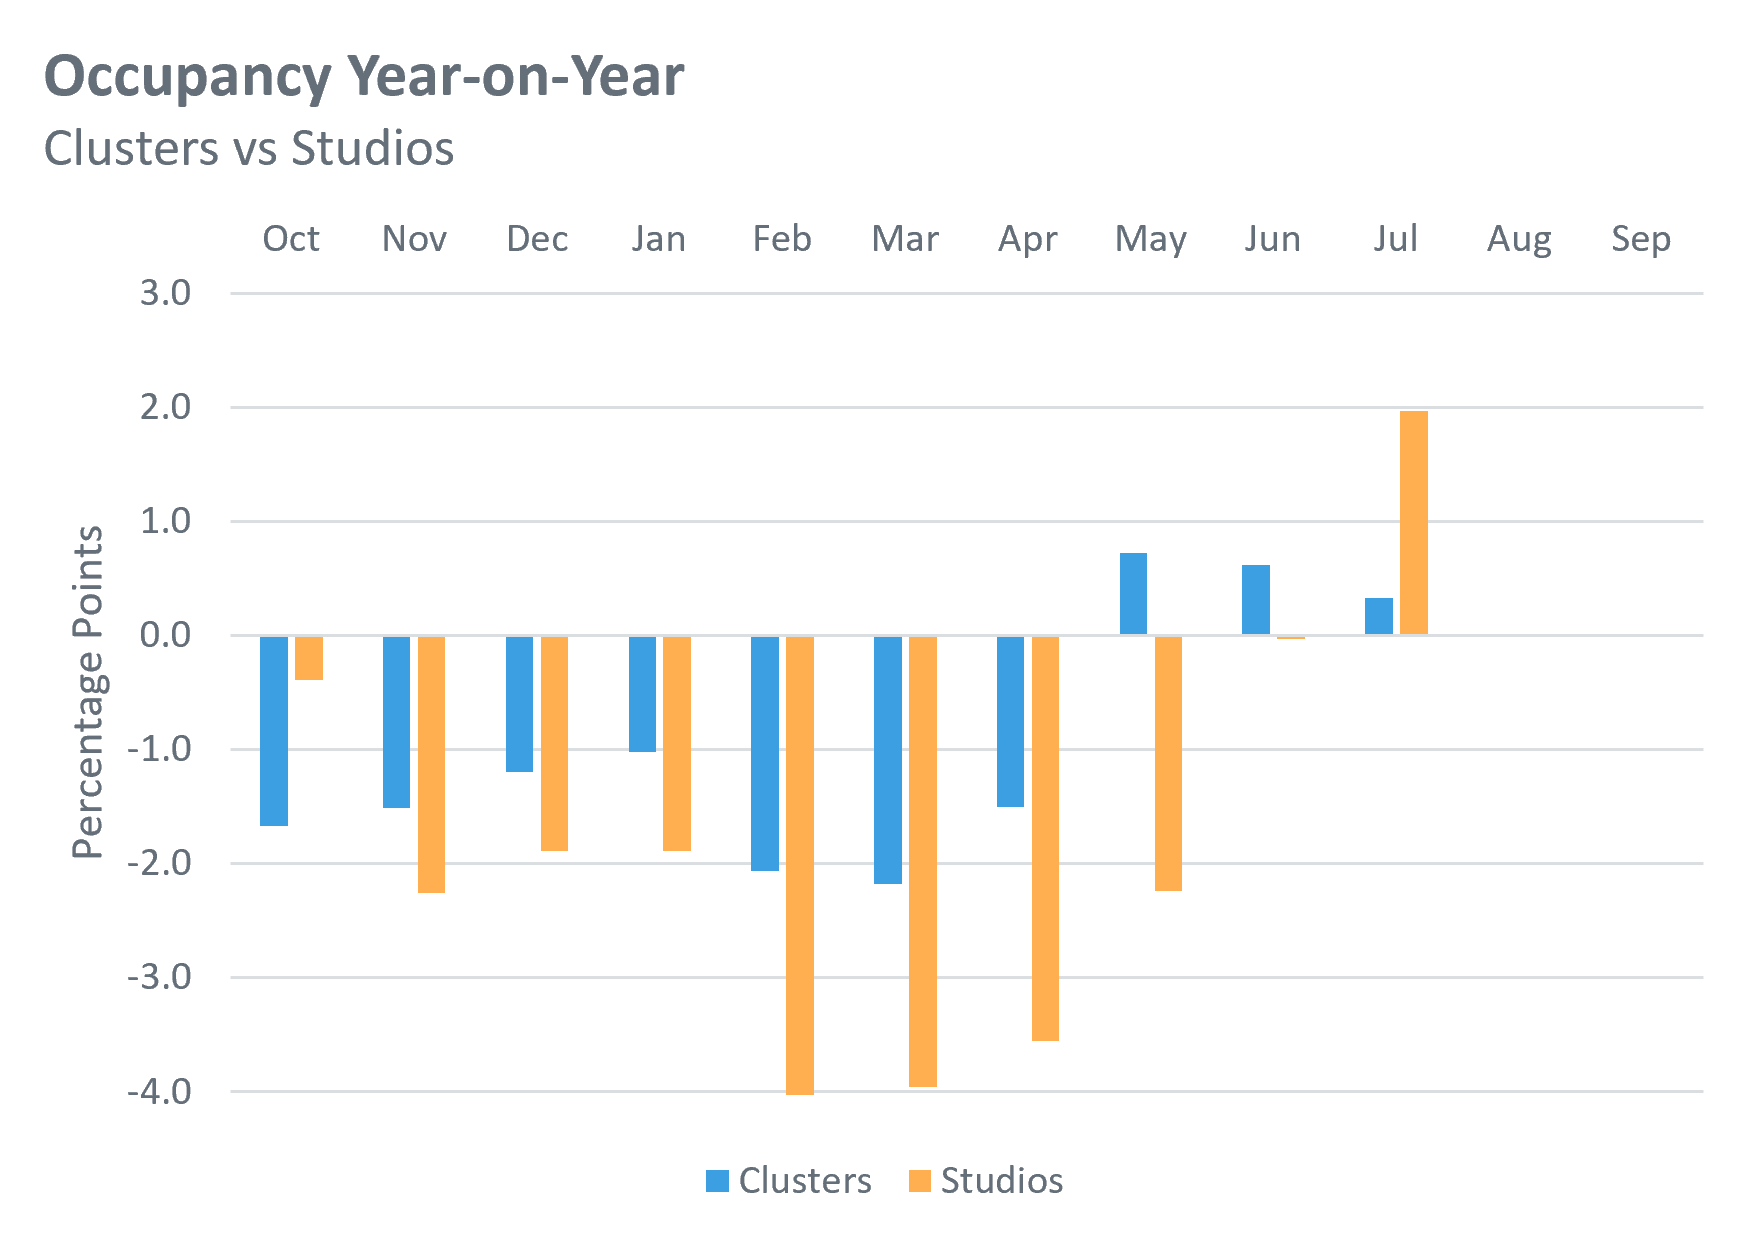
This chart shows how the YoY gap in occupancy has evolved throughout the cycle so far for both cluster beds and studios. The clusters gap switched from negative to positive in May, moving from 1.5 percentage points down in April to 0.7 points up, but now sits at +0.3 points in July after a slight slowdown in bookings. Meanwhile, the studios gap has reversed its YoY position entirely, switching from 2.2 points down in May to 2.0 points up in July.
Source: StuRents Occupancy Survey
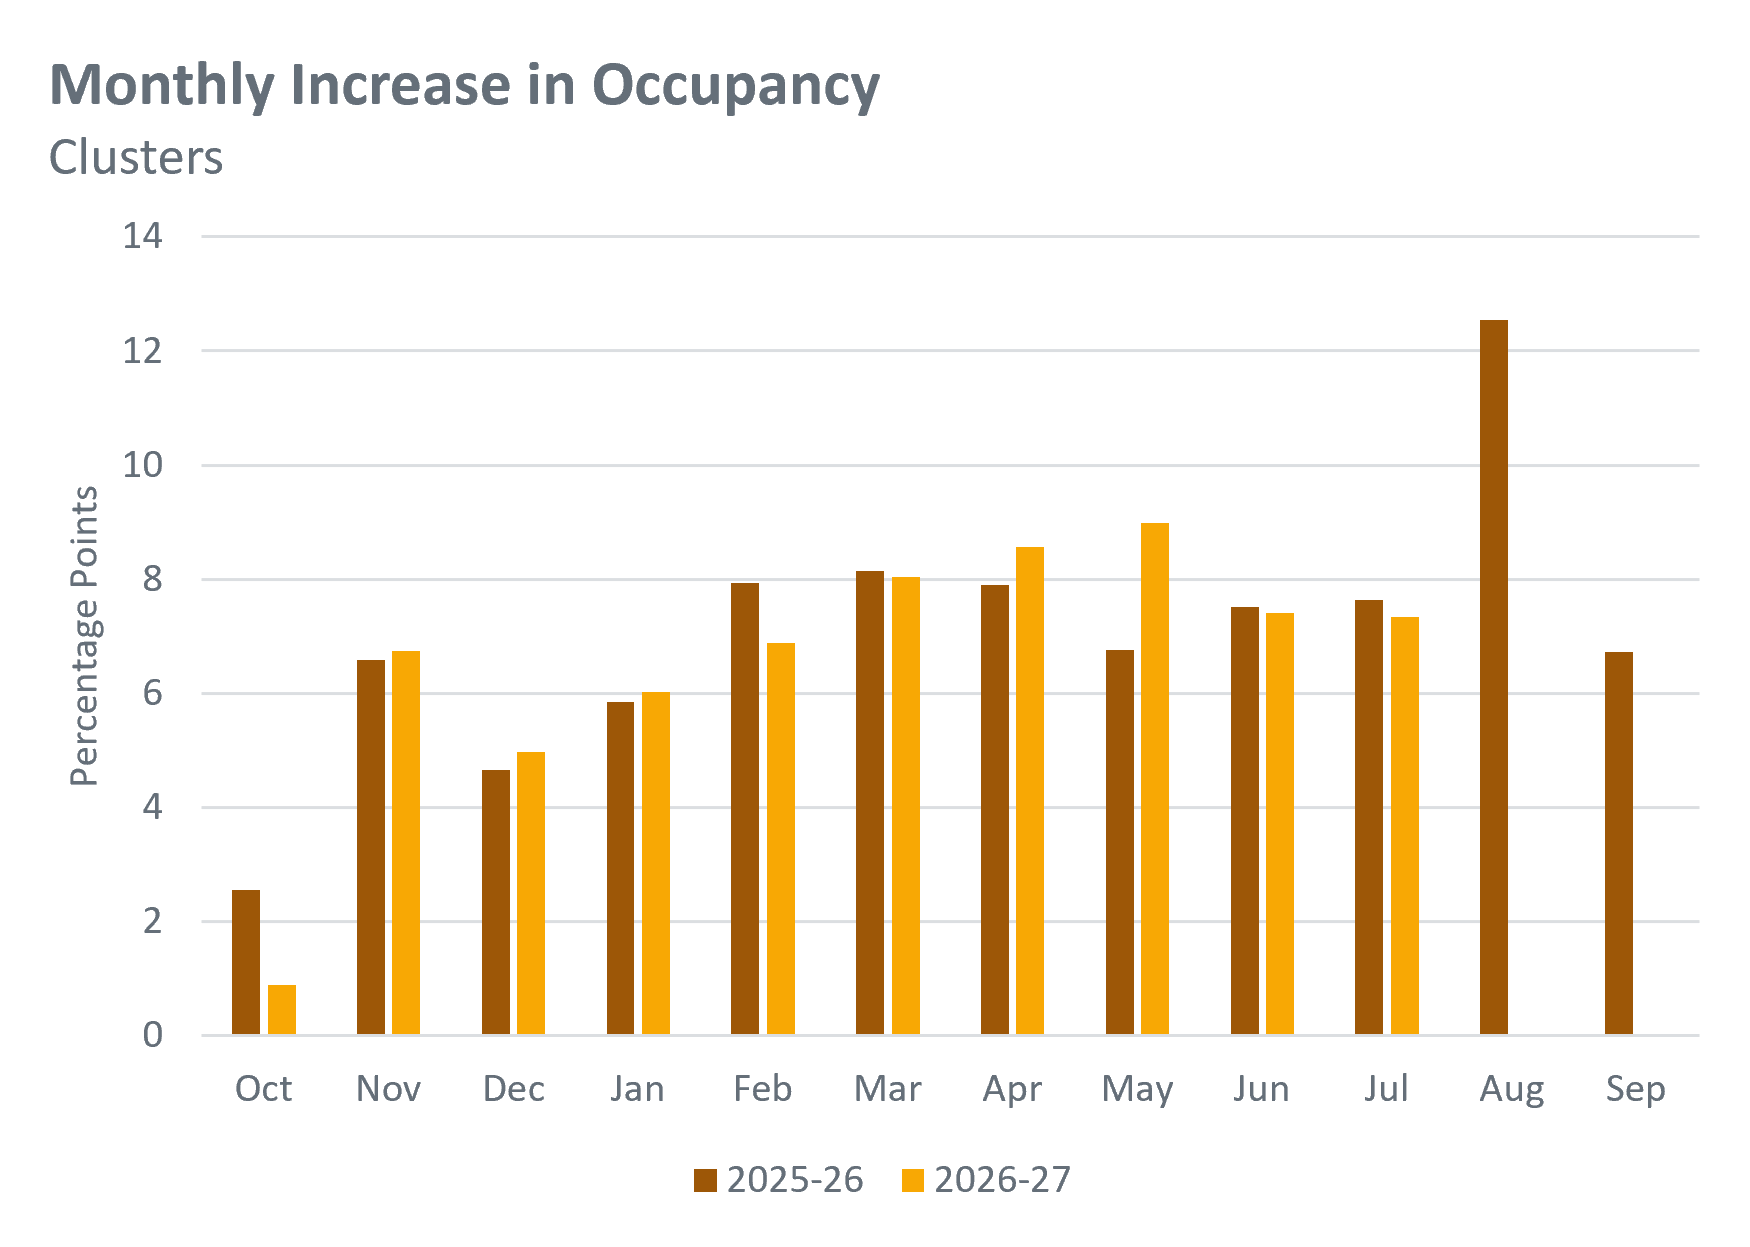
Looking at monthly momentum in cluster occupancy, May was the standout month for the 26-27 cycle, adding 9.0 percentage points – a strong uplift from the 6.8 points recorded in May 25-26. That pace has moderated in the past two months, with June and July’s near-identical 7.4 and 7.3 point gains closely mirroring that of last year.
Source: StuRents Occupancy Survey
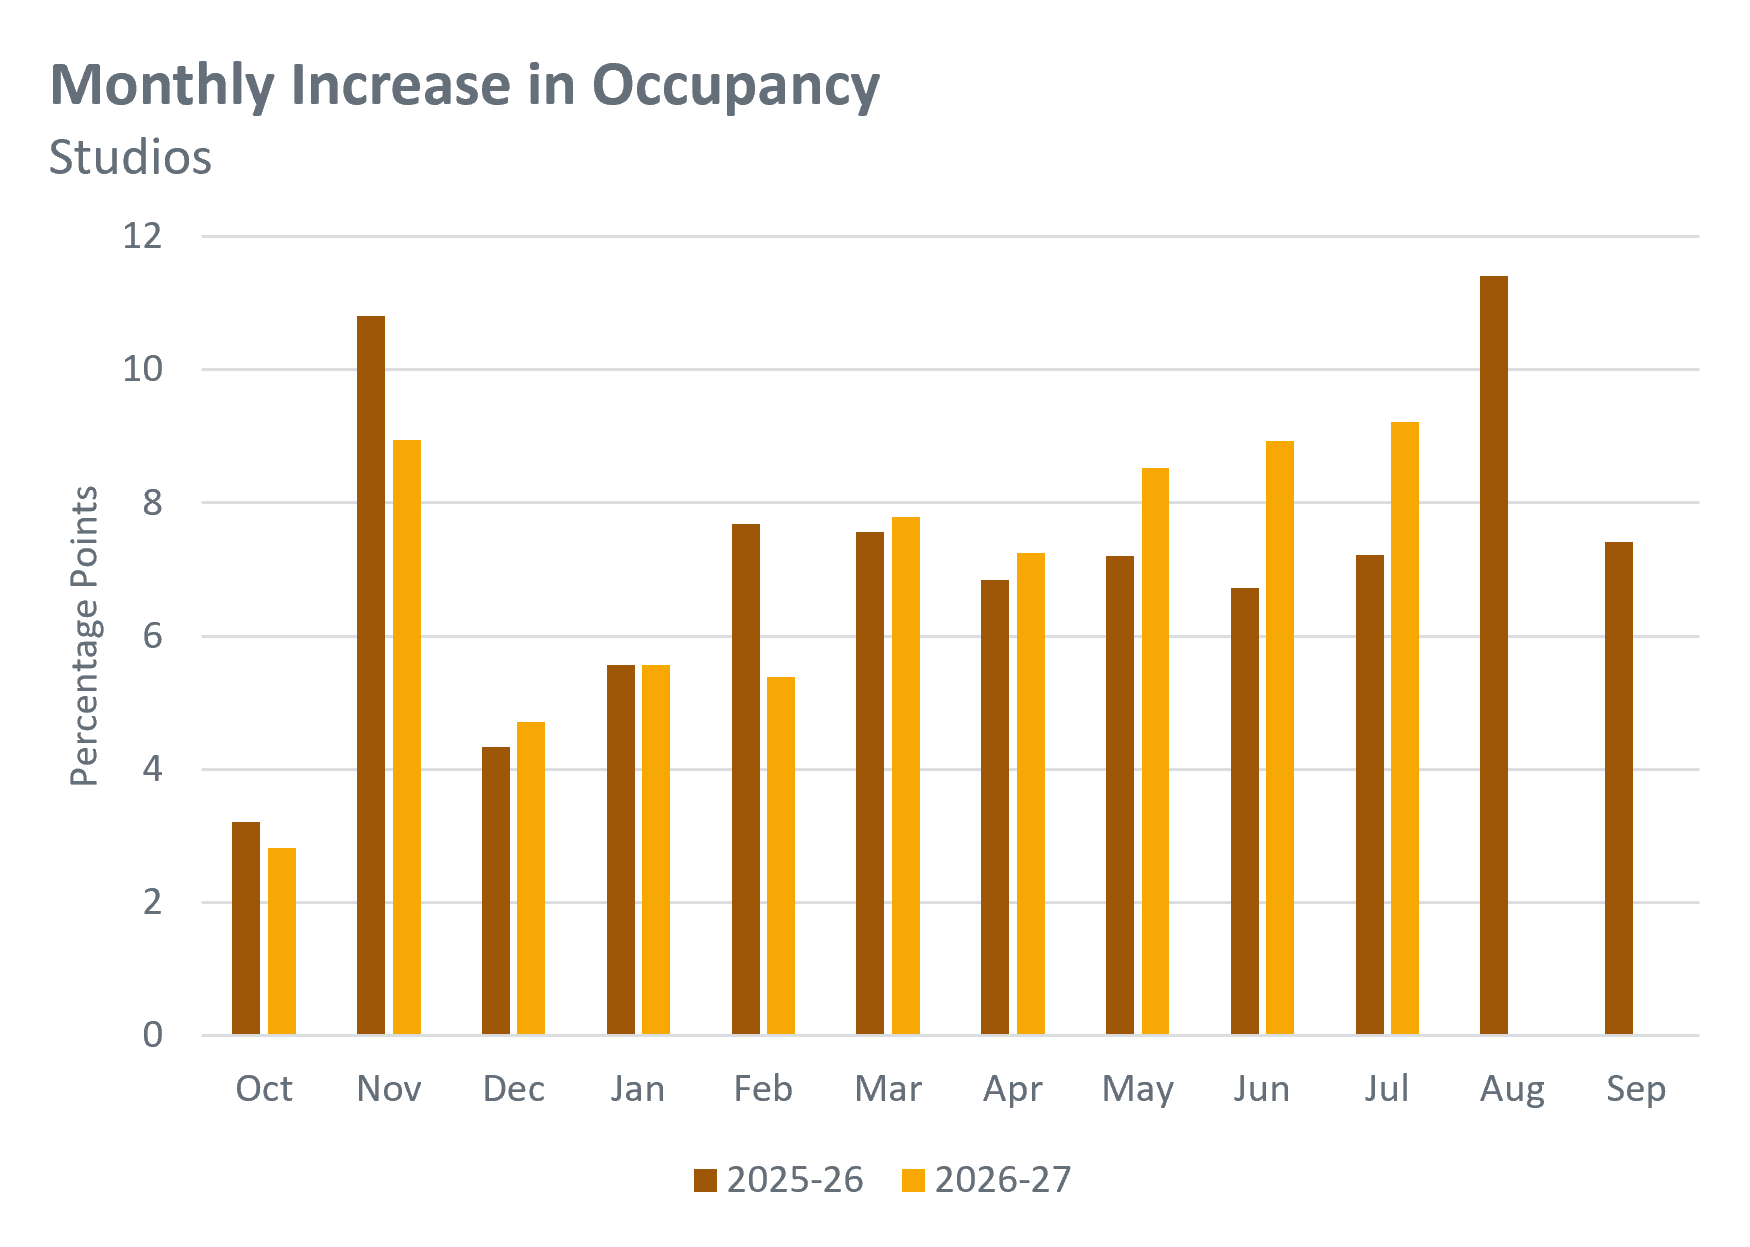
For studios, July recorded a stronger month-on-month increase than the equivalent period last year (9.2 percentage points versus 7.2) and was the strongest month of growth of the cycle so far. This contrasts last year’s pattern, where growth slowed going into early summer, whereas this year momentum continued to build.
Source: StuRents Occupancy Survey
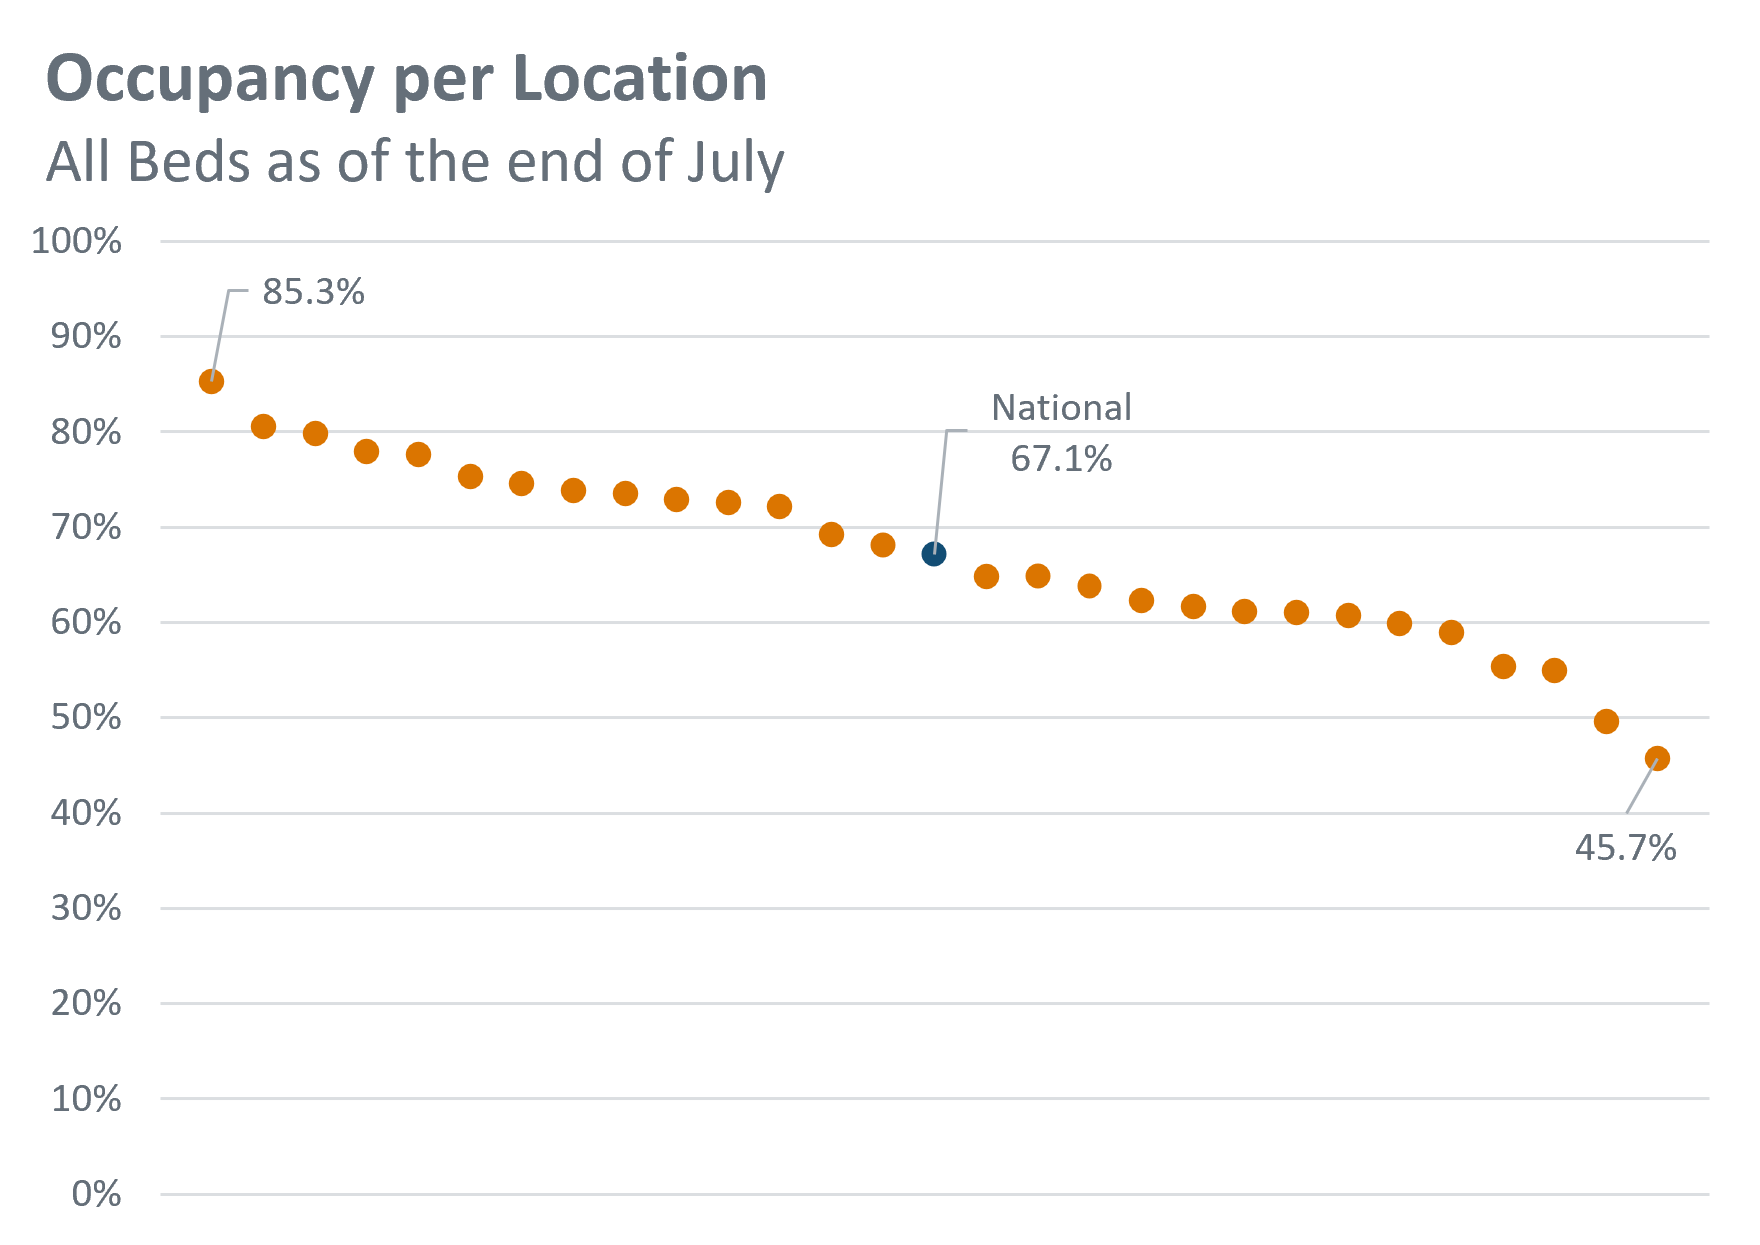
The chart above compares end-of-July occupancy across the 28 survey locations, alongside the national average. Performance continues to vary considerably, with occupancy levels ranging from 85.3% in the highest-performing location to 45.7% in the lowest. These wide disparities reflect the differing supply and demand conditions that exist across local accommodation markets in the UK.
Overall, leasing performance for 2026-27 is tracking closely to last year and continues to lag earlier cycles. However, as always, the devil is in the detail, as dynamics can vary significantly when the data is broken down by bed type and/or location.
For more information about our proprietary, highly granular data covering UK student accommodation, contact the StuRents Research team today. Book a demo of our Data Portal to find out how you can have up-to-the-minute university housing insights at your fingertips, or get in touch with us about our Occupancy Survey.
Share

Article by
Research Analyst at StuRents
Sam Gillespie is a research analyst in StuRents’ research division, StuRents Intelligence.
