
PBSA Occupancy: London vs the regions

Image courtesy of Flickr
PBSA Occupancy: London vs the regions
Occupancy remains one of the most important benchmarks in the UK student accommodation sector, and StuRents is the leading provider of this metric, with active participants managing a combined 250,000 beds. With such an extensive sample, the data allows us to report on more than a single national number and understand how leasing velocity differs between markets and even on an intra-market basis. As we have explored throughout our Quarters webinar series, those differences can be significant.
Occupancy backdrop
The last few lettings cycles have seen a clear softening in occupancy. The sector’s long-standing 95% benchmark has not been reached nationally for three consecutive years. While the delivery of new PBSA remains low, the combined effect of Built-to-Rent, lower international postgraduate numbers, and a rising proportion of commuter students has impacted occupancy since the post-Covid highs.
However, the national headline masks the fundamental differences between cities. One of the bright spots is London. Our proprietary data shows the capital has consistently outperformed the regions, and while it has not been immune from recent challenges, its relative performance is noteworthy.
London: A slower starter, but strong finisher
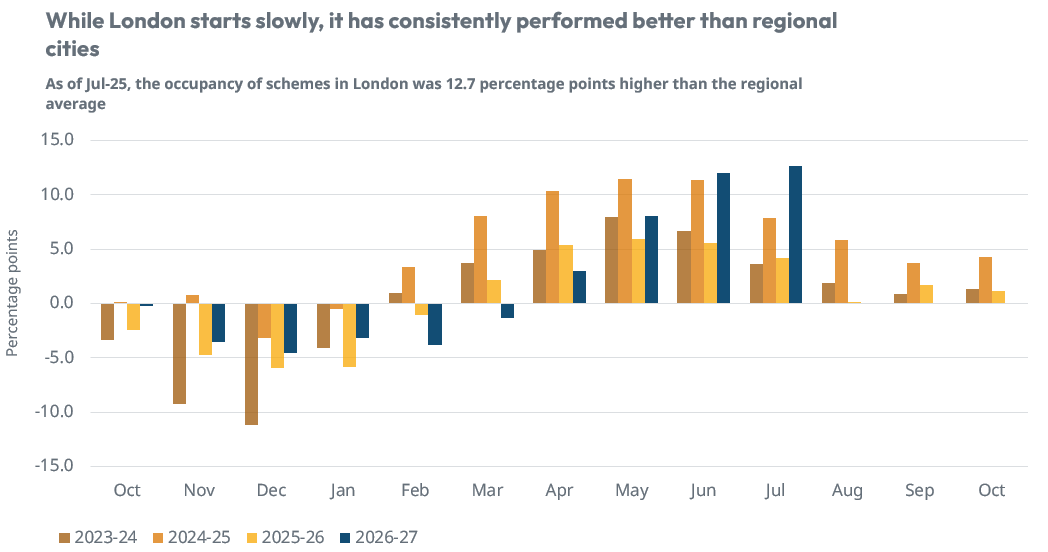
In the early period of the lettings cycle, London has consistently tracked below the national average, with October to January trailing regional cities. However, the capital’s performance soon recovers and by March has usually started to outperform other markets. With a higher exposure to postgraduates who typically commit later in the cycle, the spread then widens further and has peaked around June in the last few years. As of June-24, the capital was 11.3 percentage points ahead of regional cities, albeit this spread fell to 5.6 points as of June-2025.
What is striking from the data this year is that the difference has become more pronounced. As of July-26, London was 12.7 points ahead of the regions, with the spread having widened for four consecutive months.
Source: StuRents Occupancy Survey
Central London raises the bar
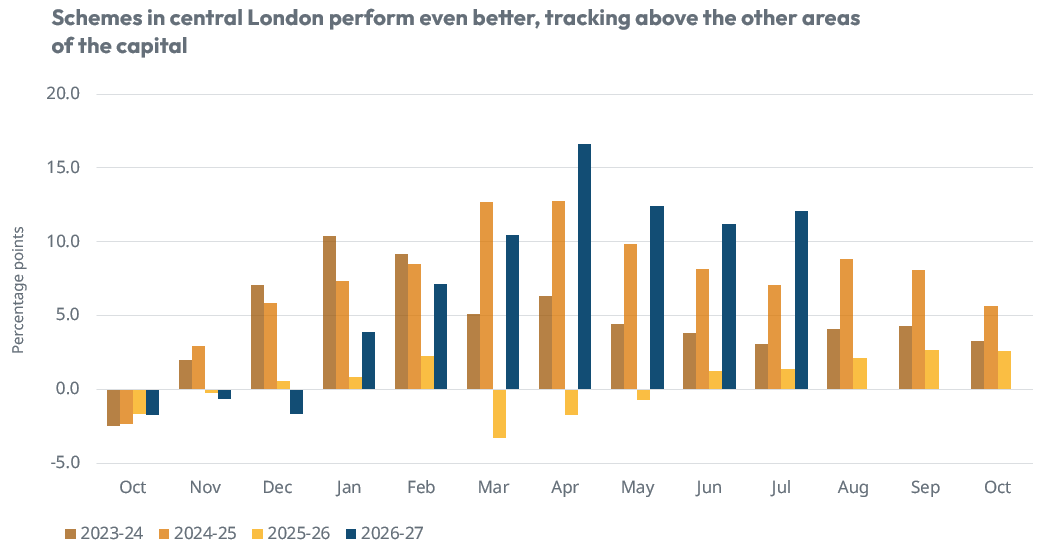
For schemes located in central London, an even more profound trend can be seen. As highlighted below, on this basis, these schemes have performed even more strongly, albeit with the same slow start and strong finish. As of July this year, the occupancy of schemes in Central London was 12.1 percentage points higher than those located elsewhere in the capital.
Source: StuRents Occupancy Survey
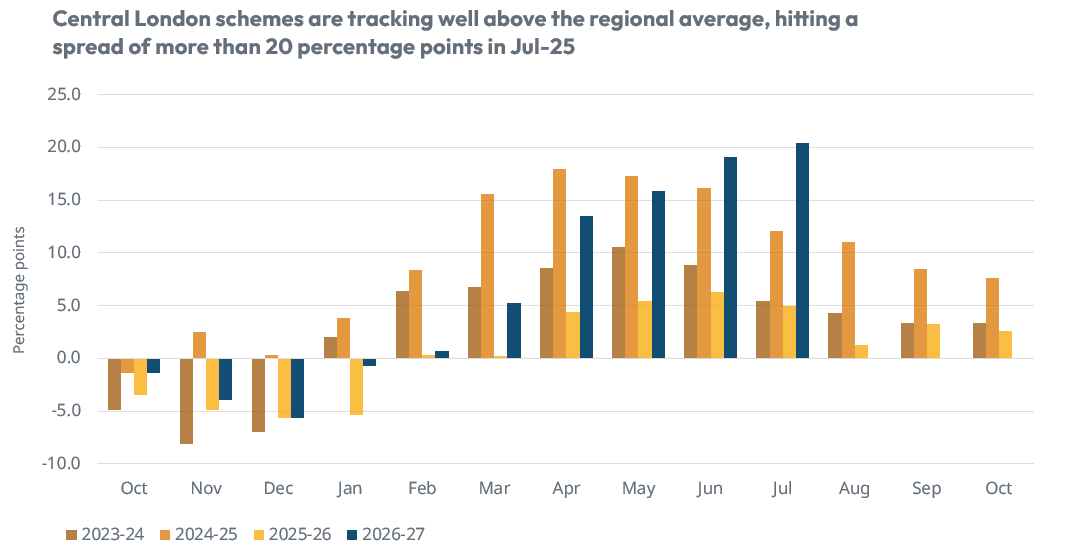
As a result, the largest difference can be found between schemes in Central London and those in the regions. As illustrated below, this spread hit a massive 20.4 points in July this year, illustrating its strong performance in relative terms.
Source: StuRents Occupancy Survey
Institutional demand
The outperformance of London, and particularly those in central London, is a function of the demand growth attributed to specific institutions. In particular, China remains a critical cohort for PBSA, especially in the capital where the premiums for this accommodation type are beyond the budgets of most domestic students.
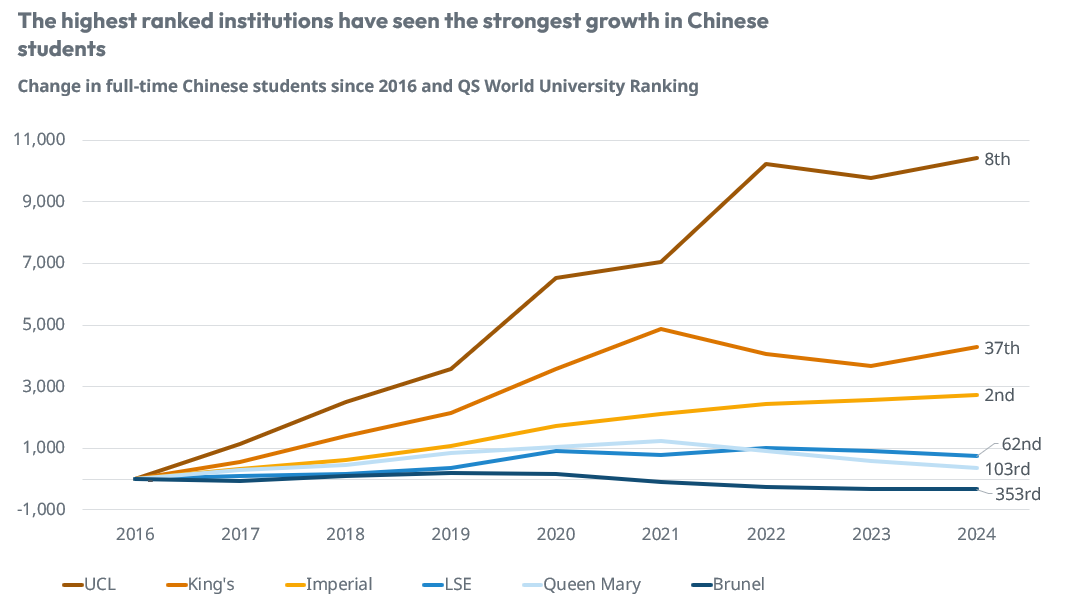
Isolating growth in full-time Chinese students since 2016 can shed light on why those centrally located schemes are performing so strongly. University College London (UCL) had 10.4k more Chinese students in 2024 compared to 2016, while King’s College London has seen growth of 4.3k over this period. Imperial has also performed strongly, with 2.7k additional Chinese students in 2024 vs. 2016. All three of these institutions sit comfortably within the QS World University Rankings top 50, a key benchmark for international students.
Those outside this, such as Brunel University, have reported a decline in Chinese students since 2016 of 340, further illustrating the importance of globally recognised institutions.
Source: StuRents, HESA, QS World University Rankings
It’s therefore clear that the most prestigious universities are propping up demand growth in the capital, especially for Chinese students, but this also explains the outperformance of centrally located PBSA.
As demand growth is tied heavily to specific institutions, it is also tightly linked to intra-city location. The map below overlays a 20-minute travel time around UCL and King’s College London, alongside London’s Central Activities Zone. This overlap shows a visual representation of why schemes located in the Central Activities Zone have performed so strongly, with easy access to the two universities reporting the strongest growth in relevant PBSA demand.
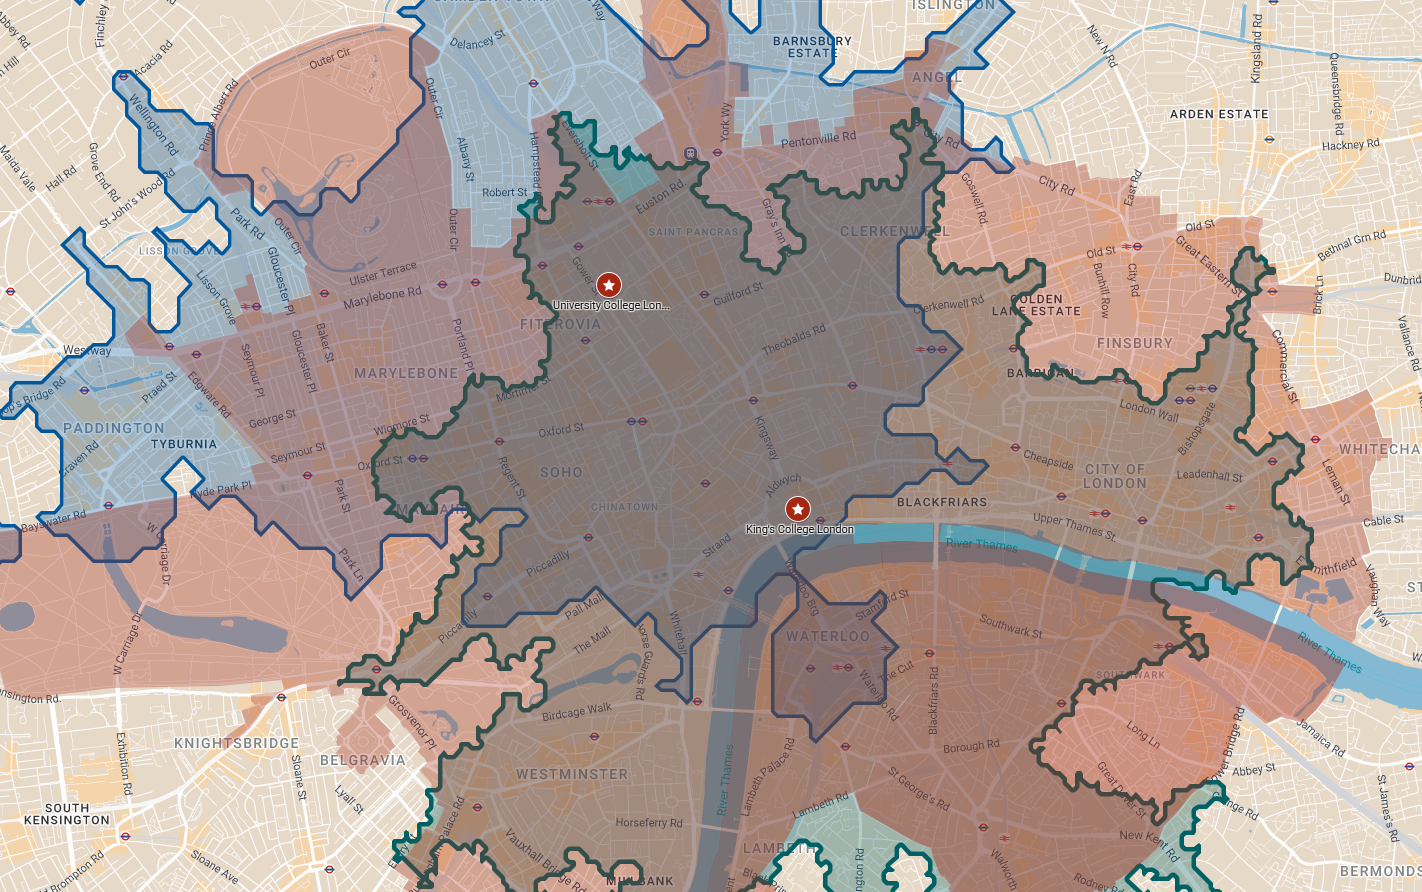
Source: StuRents, Travel Time
As demonstrated by the data, with the sector becoming ever more nuanced, understanding the drivers of performance and the variation in results will be critical to ensure optimal performance.
For up-to-date data to support rent setting, underwriting, and broader industry benchmarking, the StuRents Data Portal provides users with instant access to sector-leading data.
Share

Article by
Head of Research at StuRents
Richard leads the StuRents research team, providing proprietary, platform-driven insights to help stakeholders make better-informed decisions about the market.
