
Occupancy Update – August 2026

We are now at the height of the PBSA leasing cycle, with August typically serving as the busiest and most important month for bookings. This update explores how the market progressed through the end of last month, analysing booking trends, year-on-year performance, and seasonal patterns by bed type.
The Occupancy Survey continues to provide the most comprehensive view of UK PBSA leasing activity available, capturing around 50% of the private PBSA direct-let market and offering valuable insight into current dynamics across all major student accommodation markets.
StuRents Occupancy Survey includes private PBSA direct-let bookings only. University halls and private beds on nomination agreements are excluded.
Source: StuRents Occupancy Survey
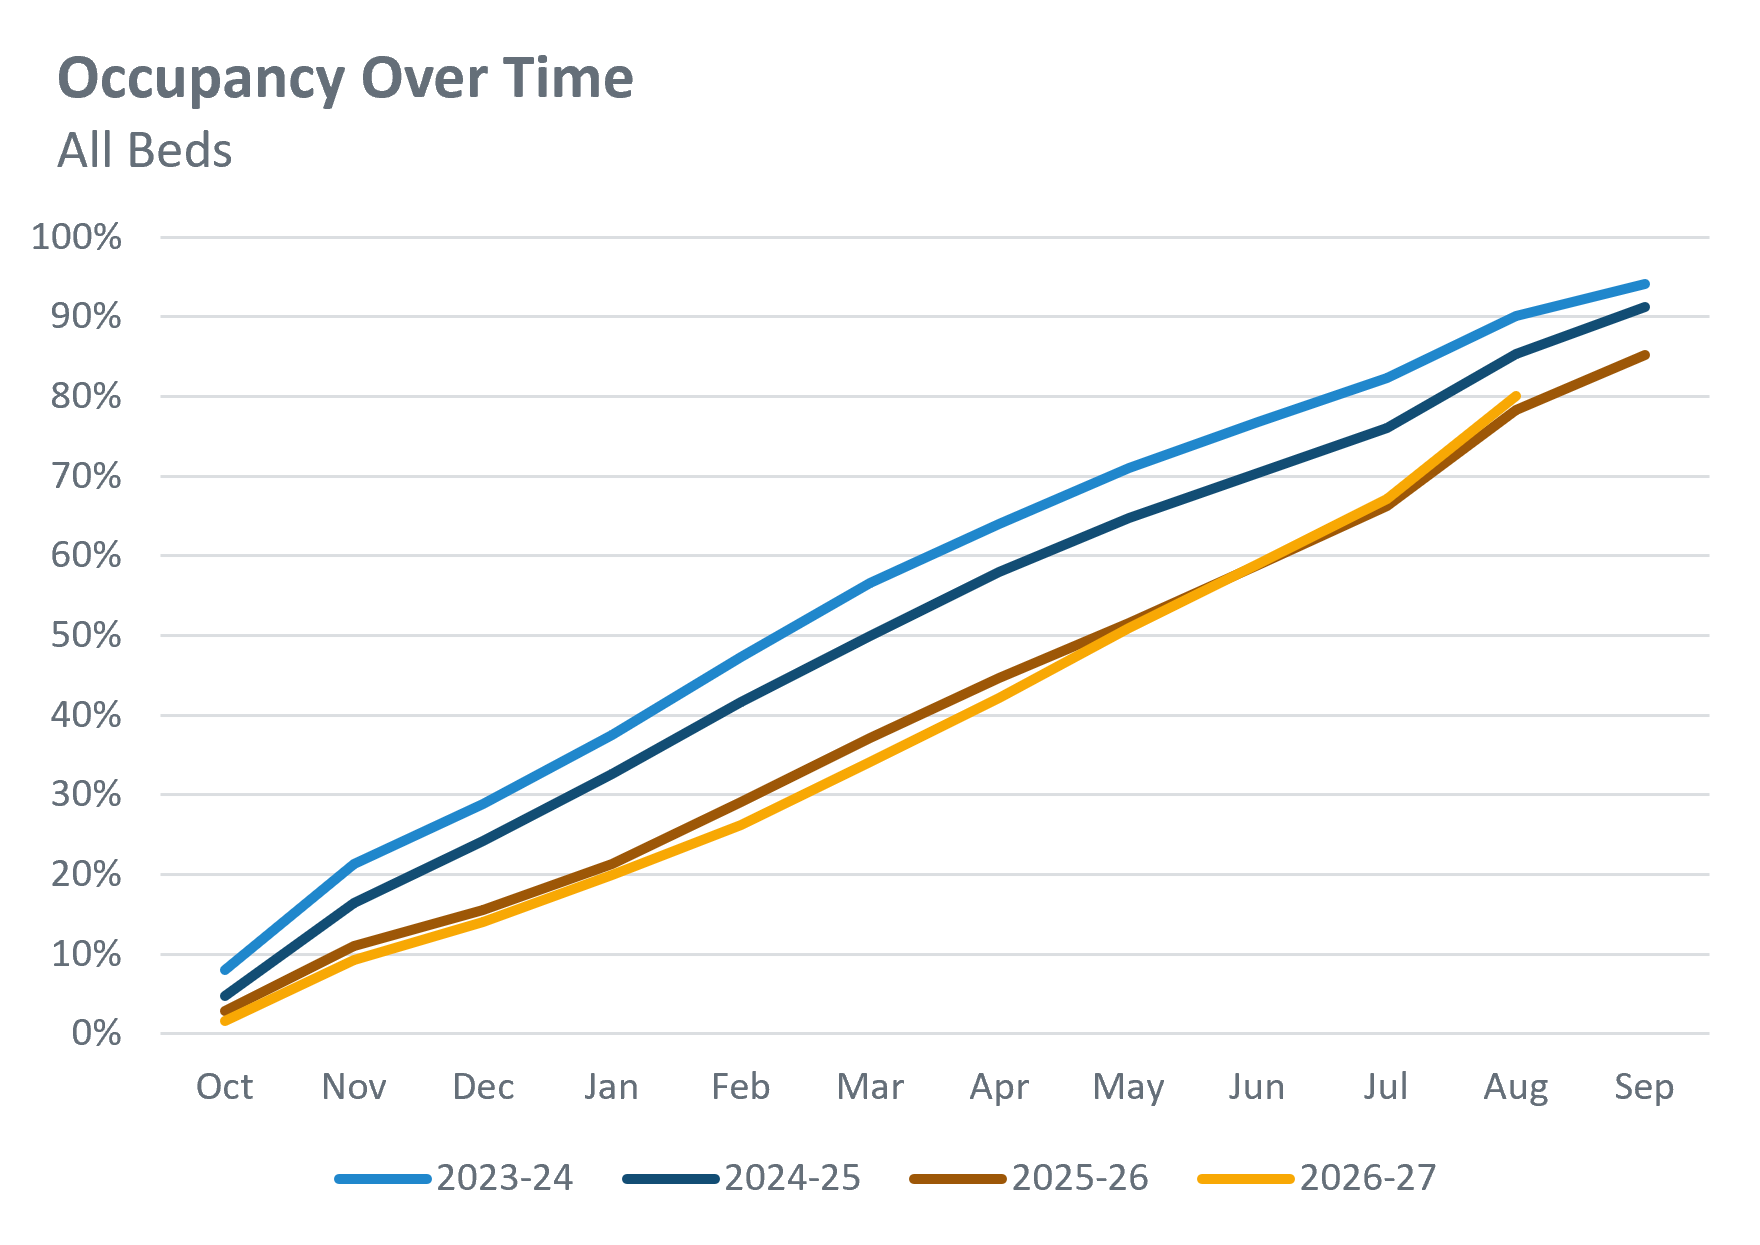
The above is showing how 26-27 has continued to track closely with that of 25-26, and has now noticeably pulled ahead year-on-year (YoY). Across all bed types in all 28 locations we cover, average occupancy for 26-27 stood at 80.1% as of the end of August. This represents a 1.8 percentage point increase YoY.
Source: StuRents Occupancy Survey
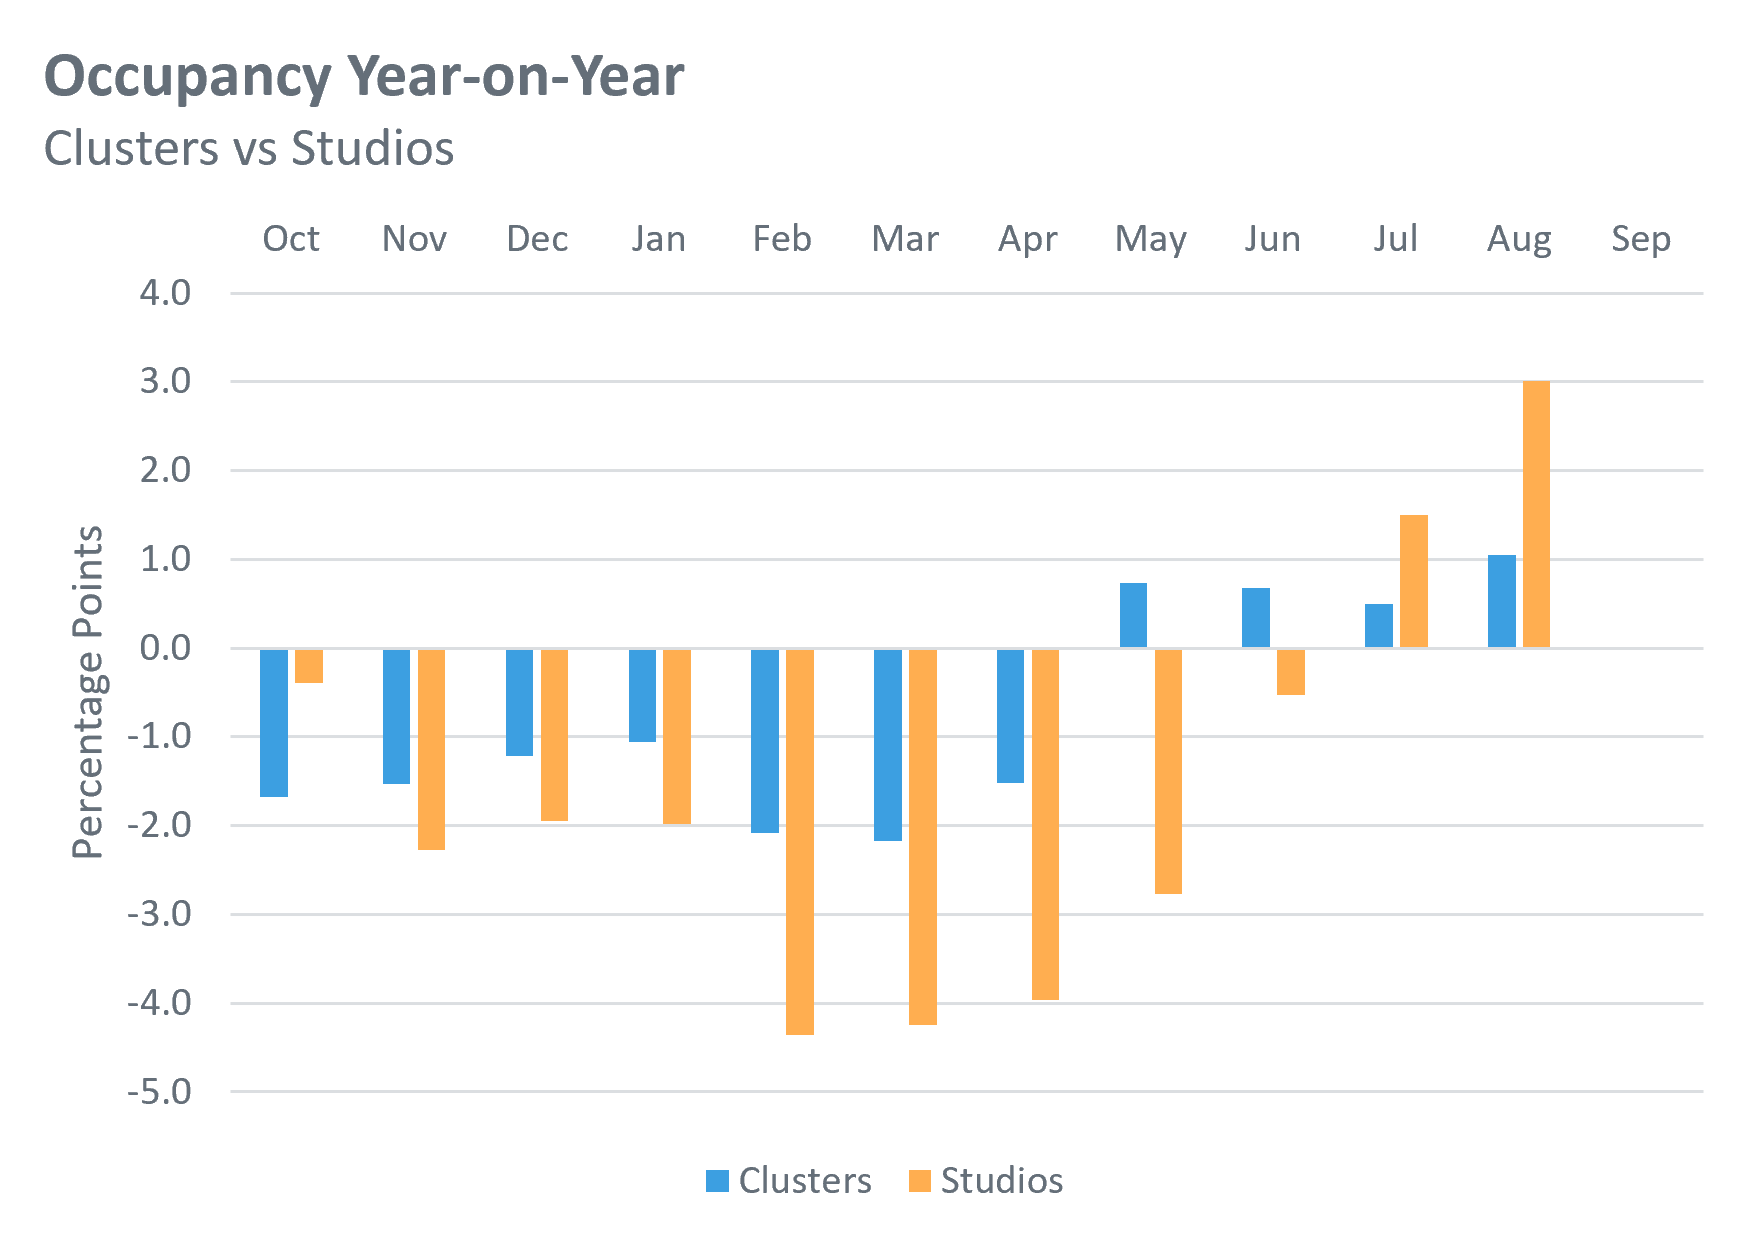
This chart is showing how the YoY gap in occupancy has changed throughout the cycle so far for both cluster beds and studios. The clusters gap switched from negative to positive in May and has maintained that lead, reaching 1.0 percentage points up in August. The studios gap has seen a somewhat dramatic recovery since spring; it flipped positive in July and has surged to 3.0 points ahead of last year as of the end of August.
Source: StuRents Occupancy Survey
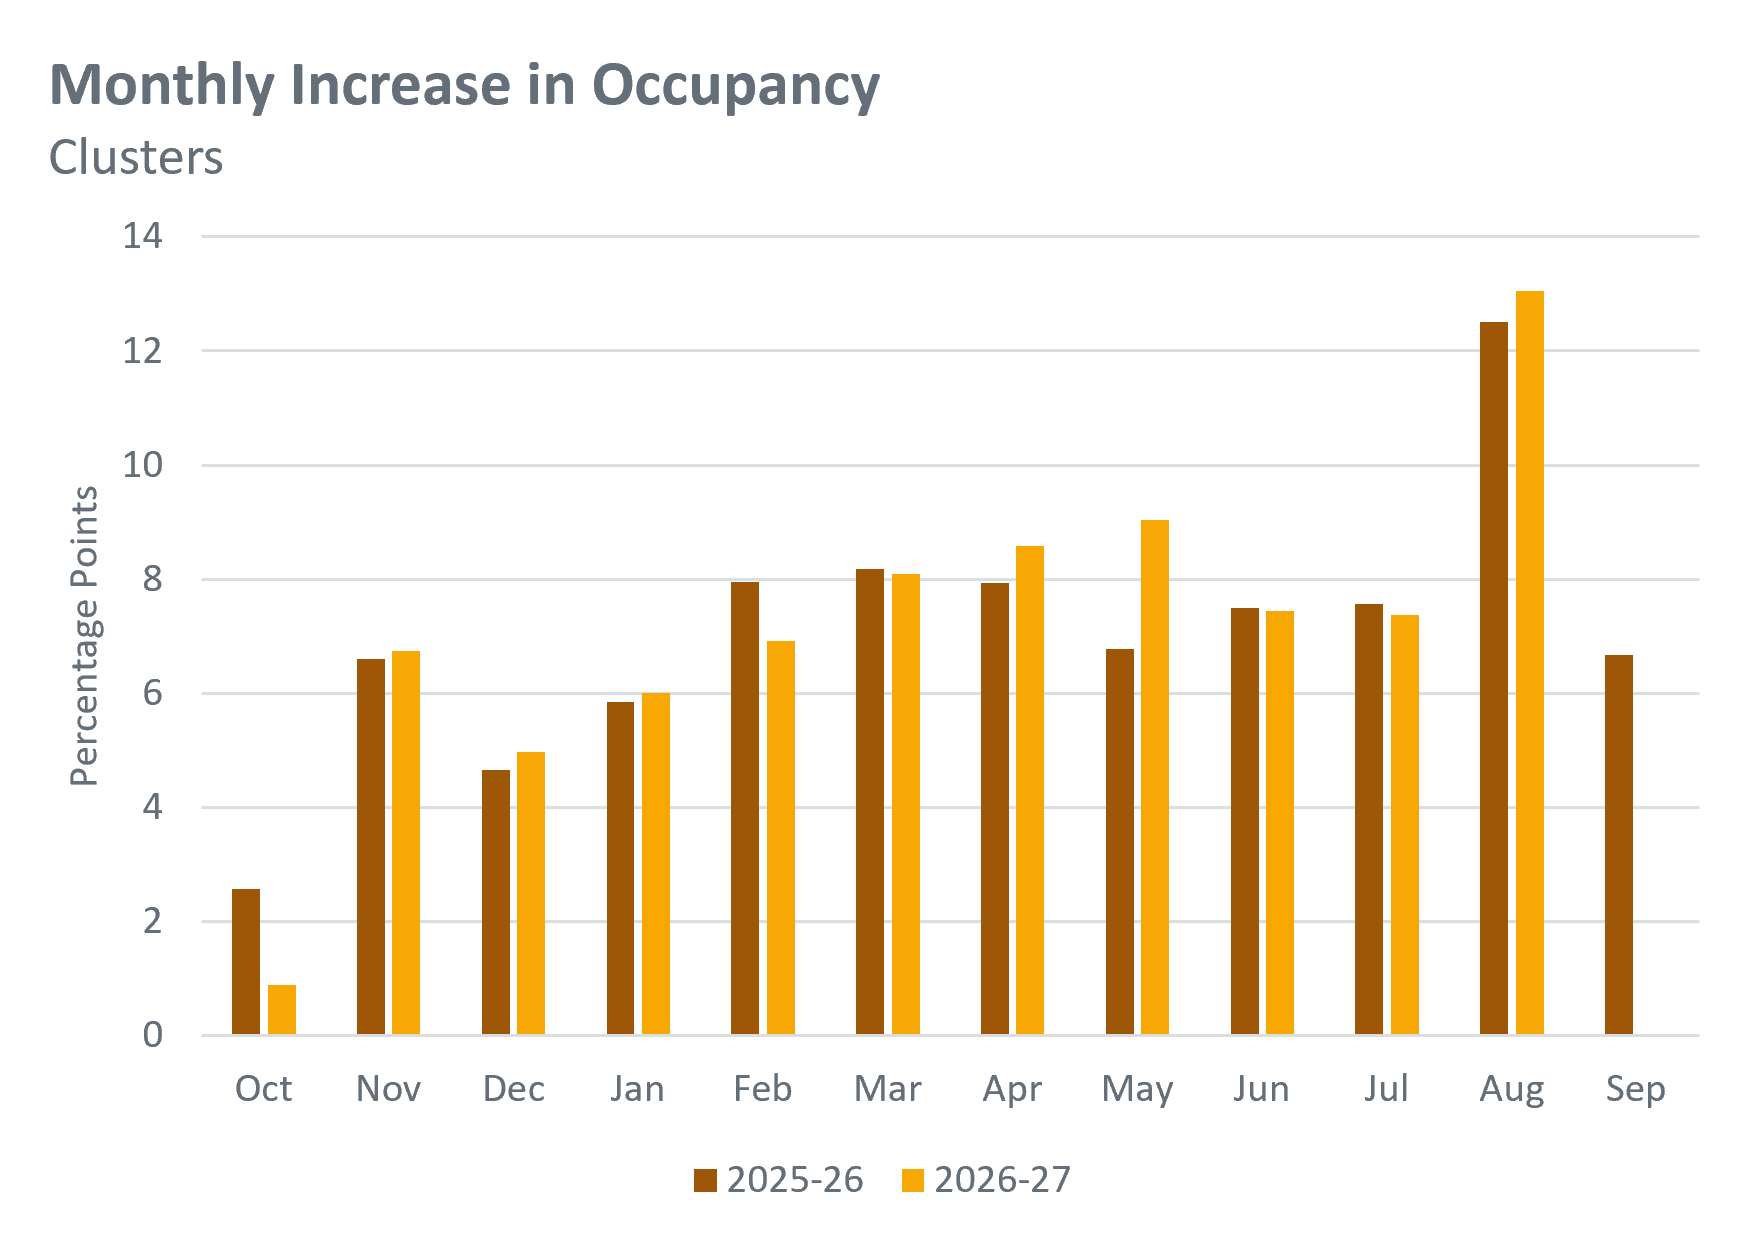
As expected for this time of year, August delivered a late-summer surge in cluster occupancy, recording a cycle-high jump of 13.0 percentage points. While this peak mirrors the pattern of the 25-26 cycle, this year's August gains slightly outpaced last year's 12.5 points, following a very steady June and July (7.4 points each).
Source: StuRents Occupancy Survey
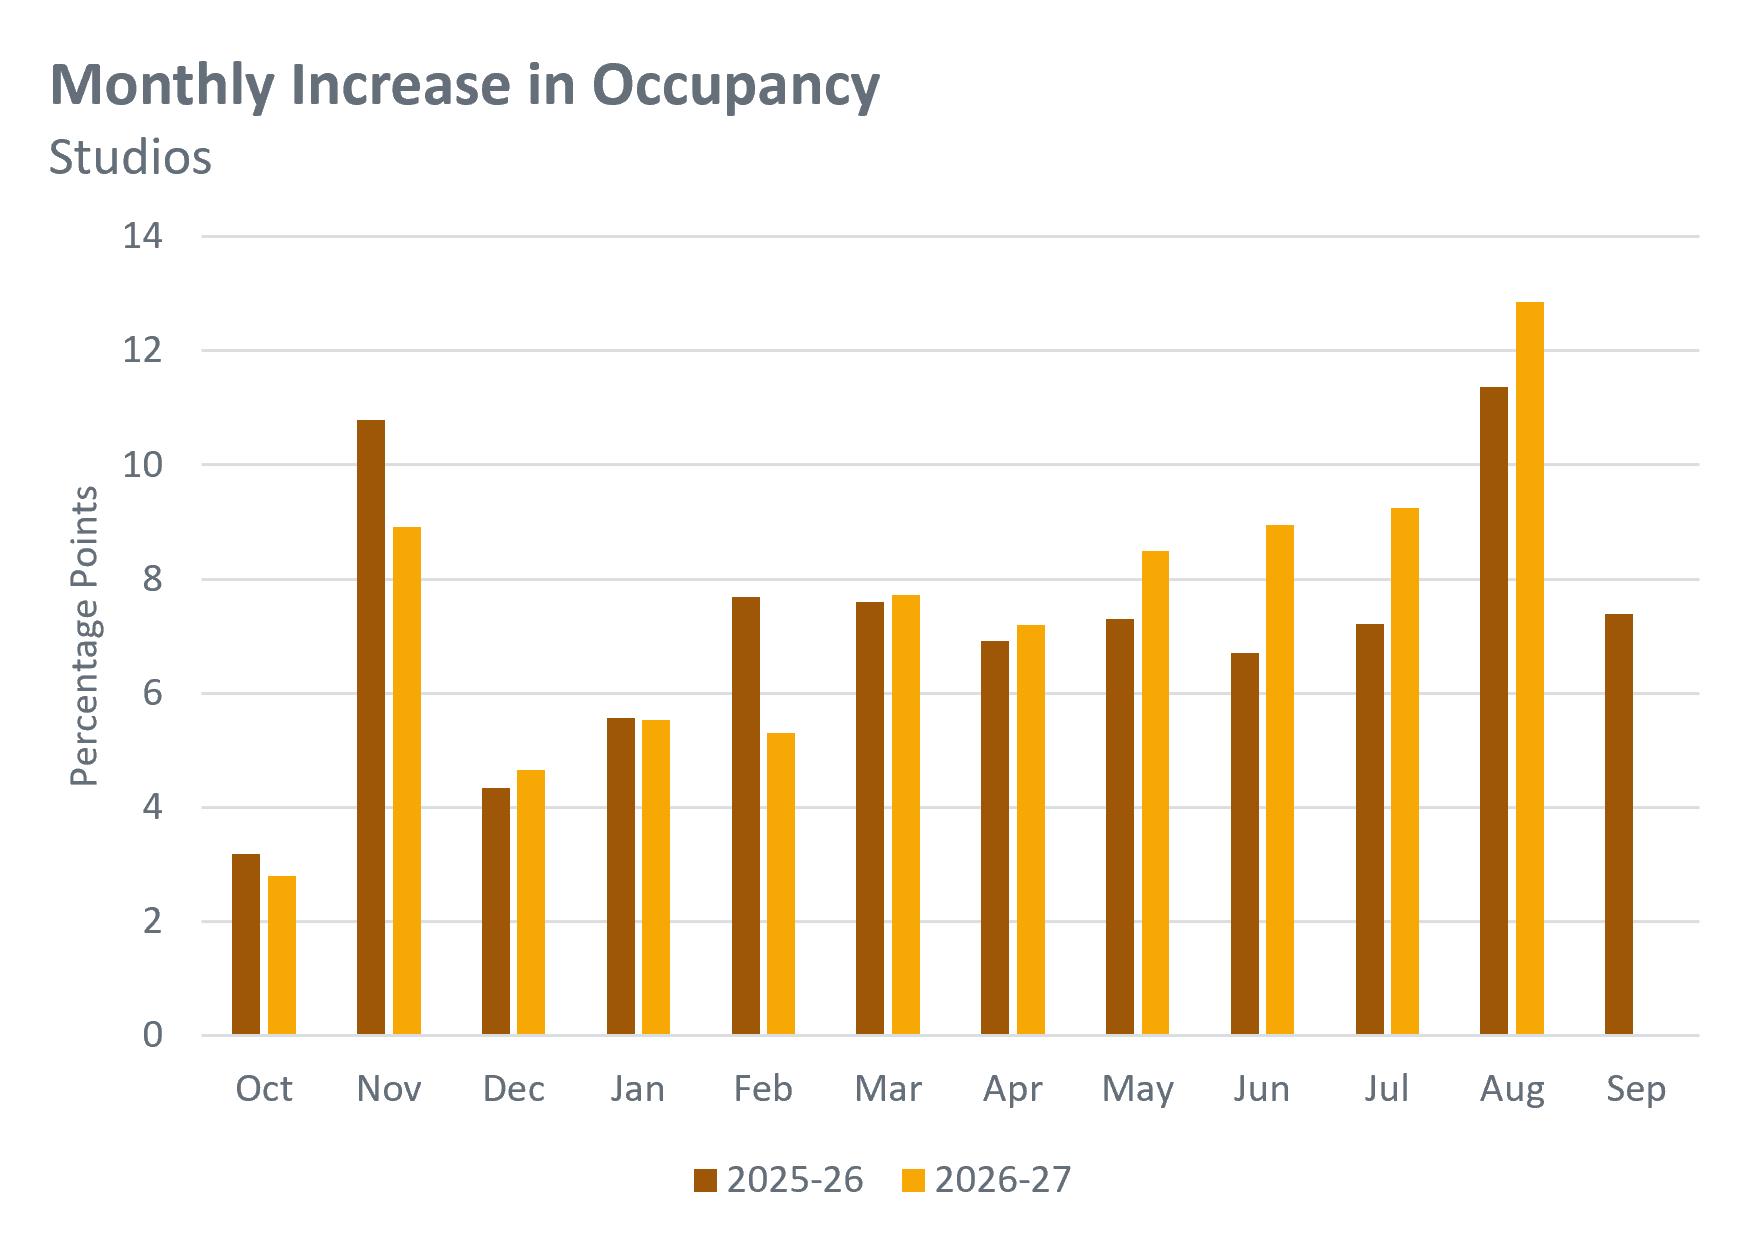
For studios, August again delivered the expectedly sharp uptick in month-on-month growth, outpacing the equivalent period last year with a 12.9 percentage point increase compared to 11.4 in 25-26. This seasonal surge marks the strongest single month of growth in the cycle so far, further reinforcing the stronger momentum seen throughout the summer months.
Source: StuRents Occupancy Survey
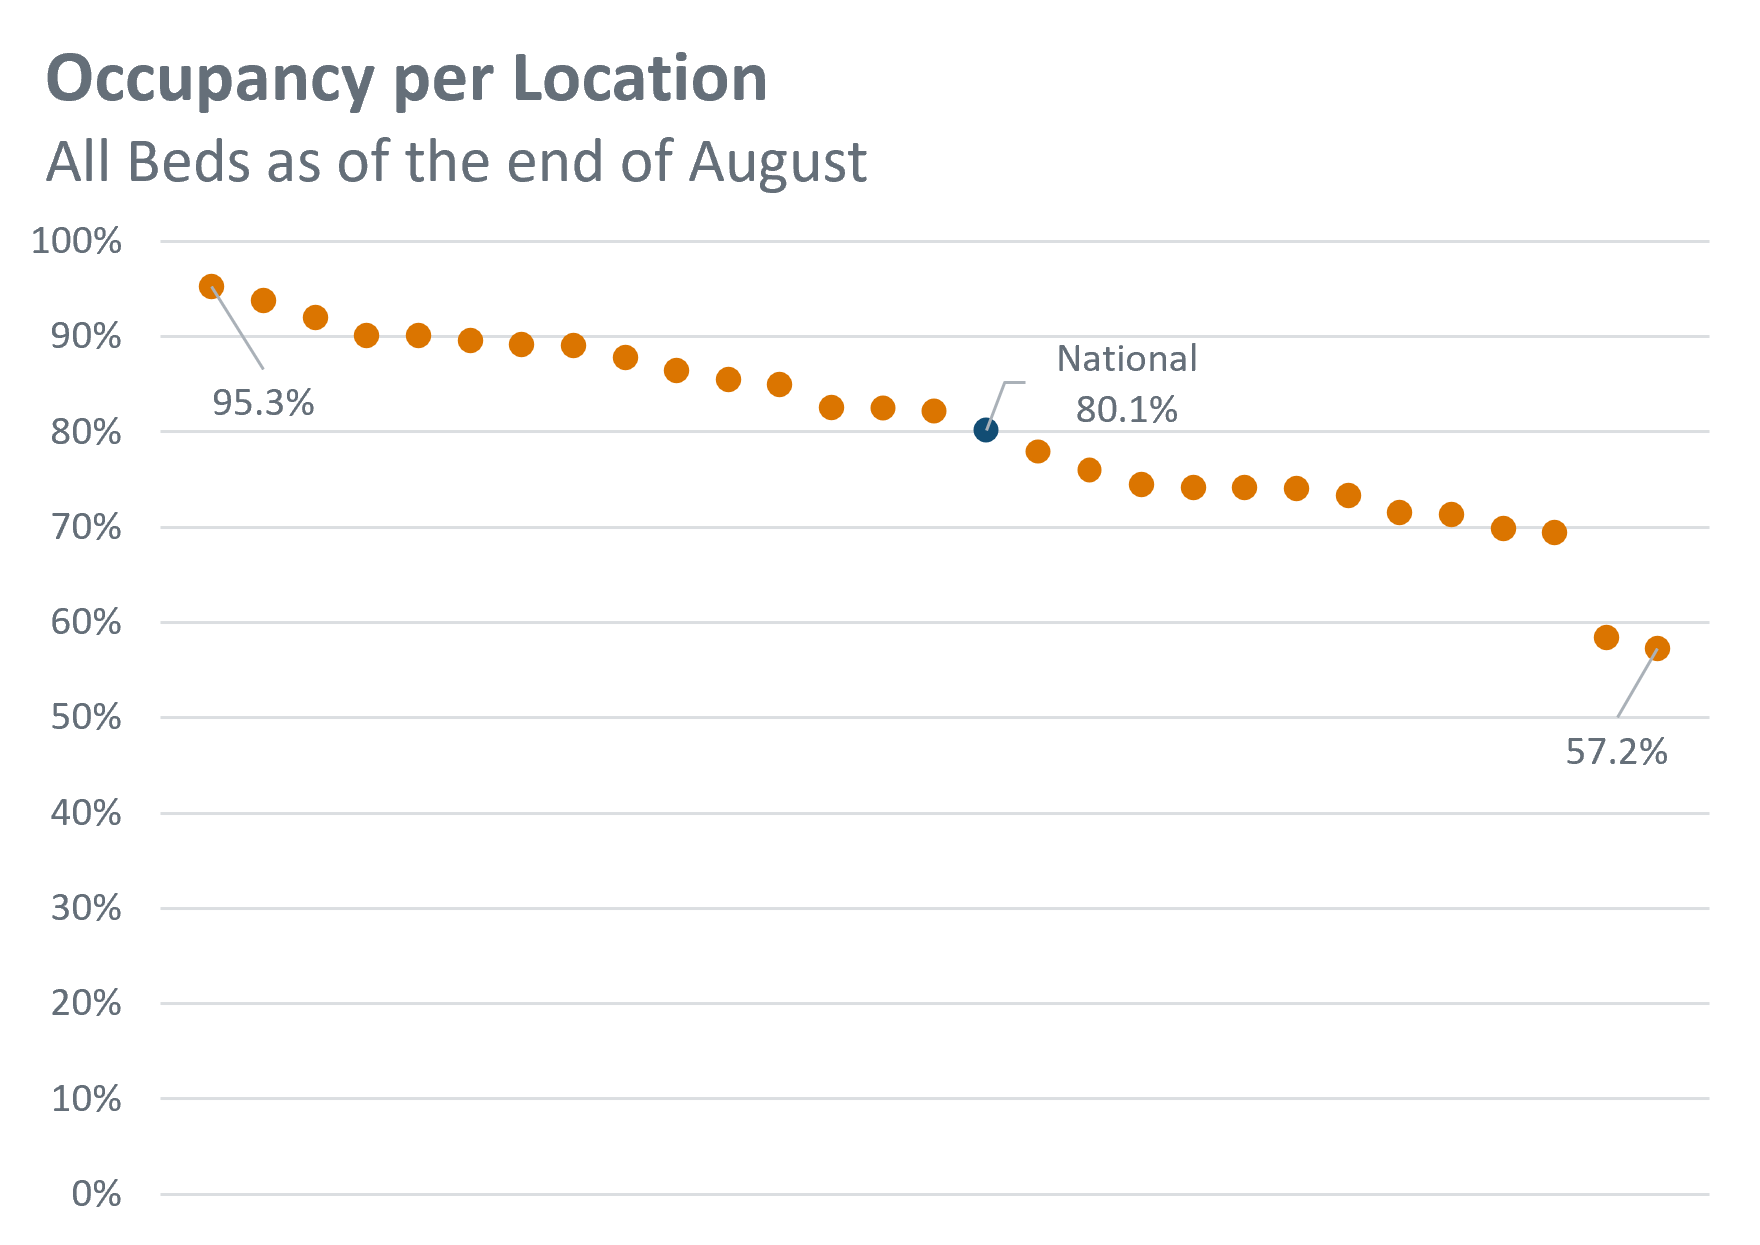
The chart above compares end-of-August occupancy across the 28 survey locations, alongside the national average. Performance continues to vary considerably, with occupancy levels ranging from 95.3% in the highest-performing location to 57.2% in the lowest. These wide disparities reflect the differing supply and demand conditions that exist across local accommodation markets in the UK.
In summary, the 2026-27 PBSA leasing cycle is concluding with decent growth, driven by a strong late-summer surge in bookings. National occupancy reached 80.1% by the end of August, marking a 1.8 percentage point increase year-on-year, bolstered significantly by a pronounced late-season recovery in studio demand. However, the 38.1 percentage point disparity between the highest and lowest performing locations underlines that the UK market remains highly fragmented, with asset performance heavily dependent on localised supply and demand fundamentals.
For more information about our proprietary, highly granular data covering UK student accommodation, contact the StuRents Research team today. Book a demo of our Data Portal to find out how you can have up-to-the-minute university housing insights at your fingertips, or get in touch with us about our Occupancy Survey.
Share

Article by
Research Analyst at StuRents
Sam Gillespie is a research analyst in StuRents’ research division, StuRents Intelligence.
