Student numbers and housing supply data
Identify data on market opportunity and student accommodation shortage
Trusted by:


45+
Locations analysed
2,500+
Tracked live schemes
5+
Years of data
Independent supply and demand analysis from the UK’s largest student platform
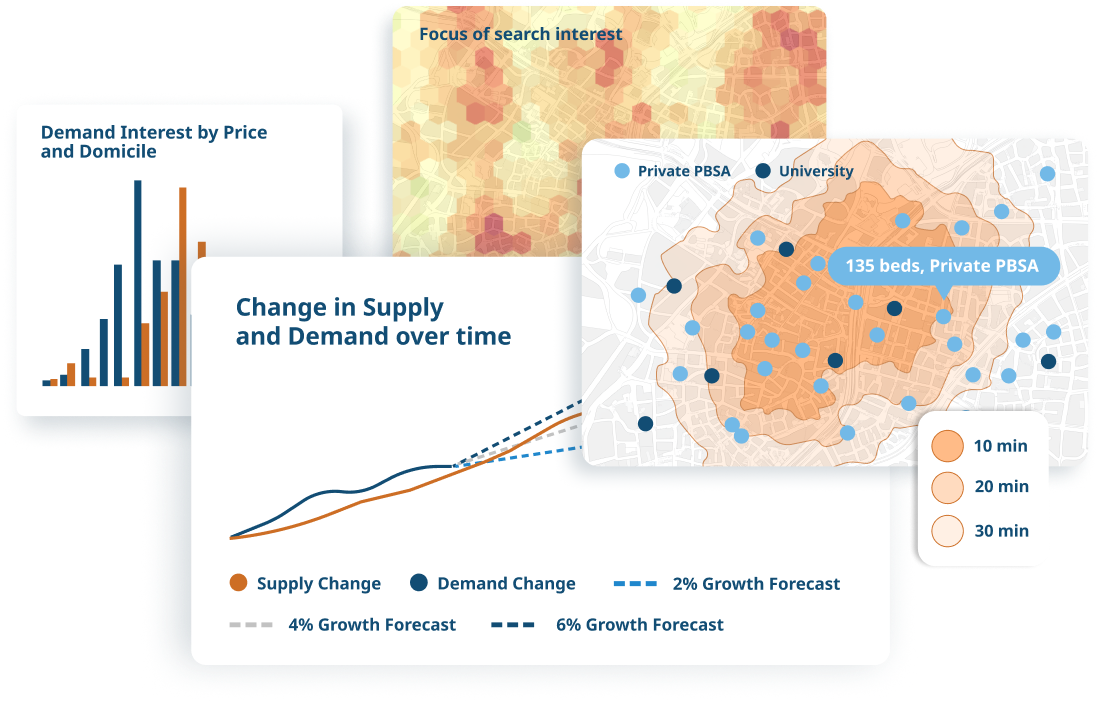
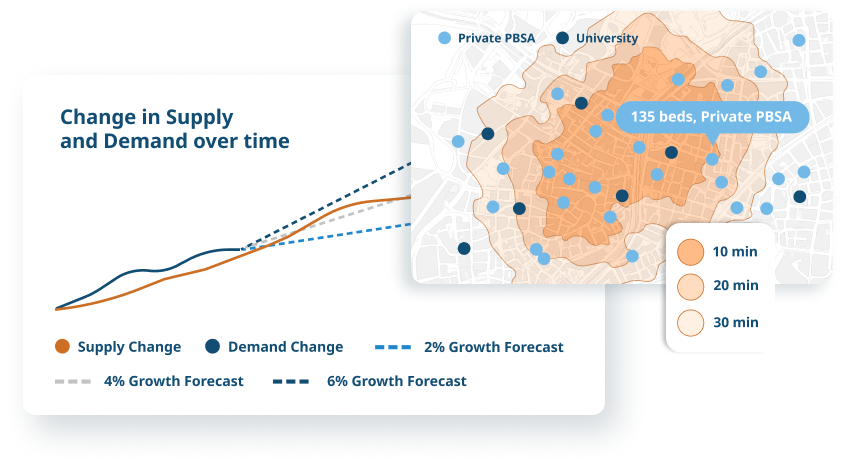
Identify future opportunities and risks with supply vs demand forecasts
- Assess whether there is a surplus or shortage of student accommodation in your market
- Understand how rents and occupancy will be impacted by changing supply and demand
- Gain insight into fundamentals at a micro level and what this means for individual asset performance
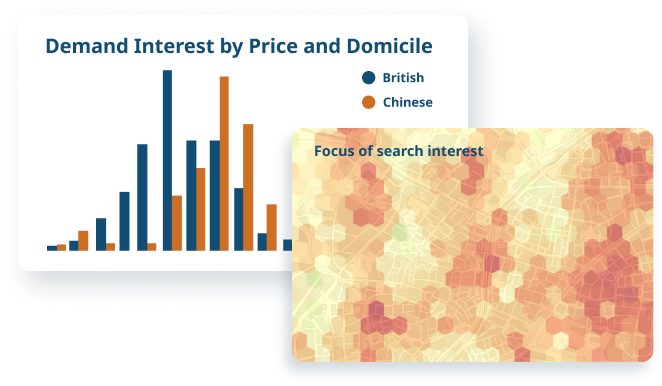
Inform your investment strategies with student search trends
- Use behaviour data to understand what students really want
- Evaluate demand by price, location, demographic and accommodation type to inform your underwriting
- Adjust your rental strategy to meet current demand
Ready to start?
Get independent analysis of sector fundamentals to help identify market opportunities and risks.
Student accommodation research services

Data Portal
Access proprietary data covering student demand, supply, planning and more to identify UK market opportunities.
Explore
Occupancy Survey
Unlock timely PBSA leasing data and discover how operational efficiencies can impact your bottom line.
Explore
Rent Benchmarking
Understand pricing of all HMO and PBSA segments, as well as at what price points students are searching, enquiring and booking, to help ensure your rents are fully optimised.
ExploreFAQs about StuRents Supply and Demand Data
Book a demo to gain independent insights
Identify opportunities and risks

More than 45 locations analysed
Updated monthly to provide the latest analysis
Understand historical and future changes to supply and demand