
UCAS Clearing Update: 15 Days After JCQ Results Day

The latest data from UCAS has been released showing interesting insights into the demographic of students that have been accepted to UK institutions as of 15 days after JCQ results day. This is the last data release that will be made by UCAS until after day 28, which marks the end of the Clearing cycle.
Key findings:
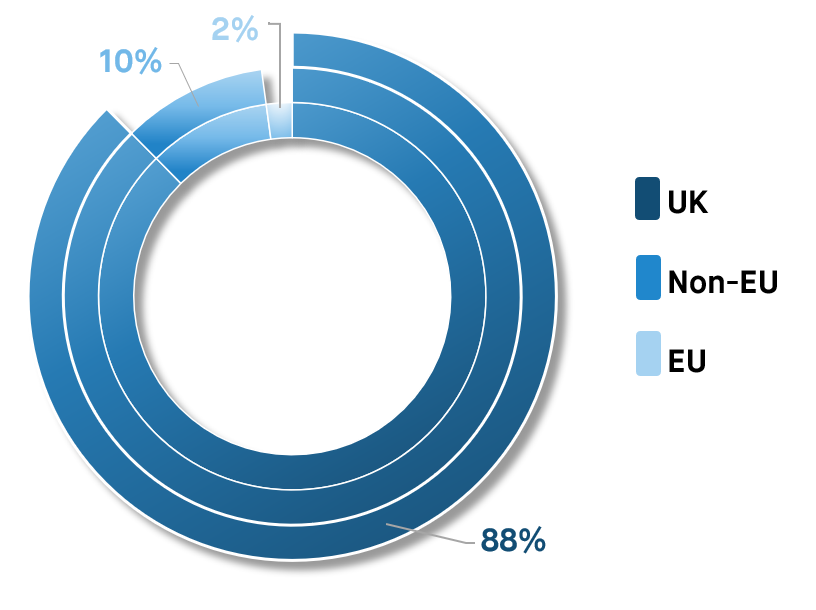
- The proportion of accepted students by domicile remains consistent with the previous year, with 88% from the UK, 10% from non-EU countries, and the remainder originating from Europe.
- EU student acceptances have seen an 8.5% YoY increase, the first uptick since 2018.
- Conversely, non-EU student acceptances have dropped by 1.1%, the first decline since 2016.
- More than half of international acceptances are attributed to Asian students, with China accounting for 24%.
- India exhibits the most substantial acceptance growth since 2017, surging by 158% in six years.
- Total acceptances have decreased for Lower and Medium tariff universities and increased modestly (0.4%) at Higher tariff institutions.
- Non-EU student acceptances have risen at Lower and Medium tariff providers but decreased by 2.7% at Higher tariff institutions.
Source: UCAS
The chart above depicts the domicile distribution of accepted students according to UCAS's latest data. Domestic students constitute 88% of acceptances, while students from non-EU countries represent 10%, with the remaining 2% coming from European nations, mirroring the previous year's figures.
Source: UCAS
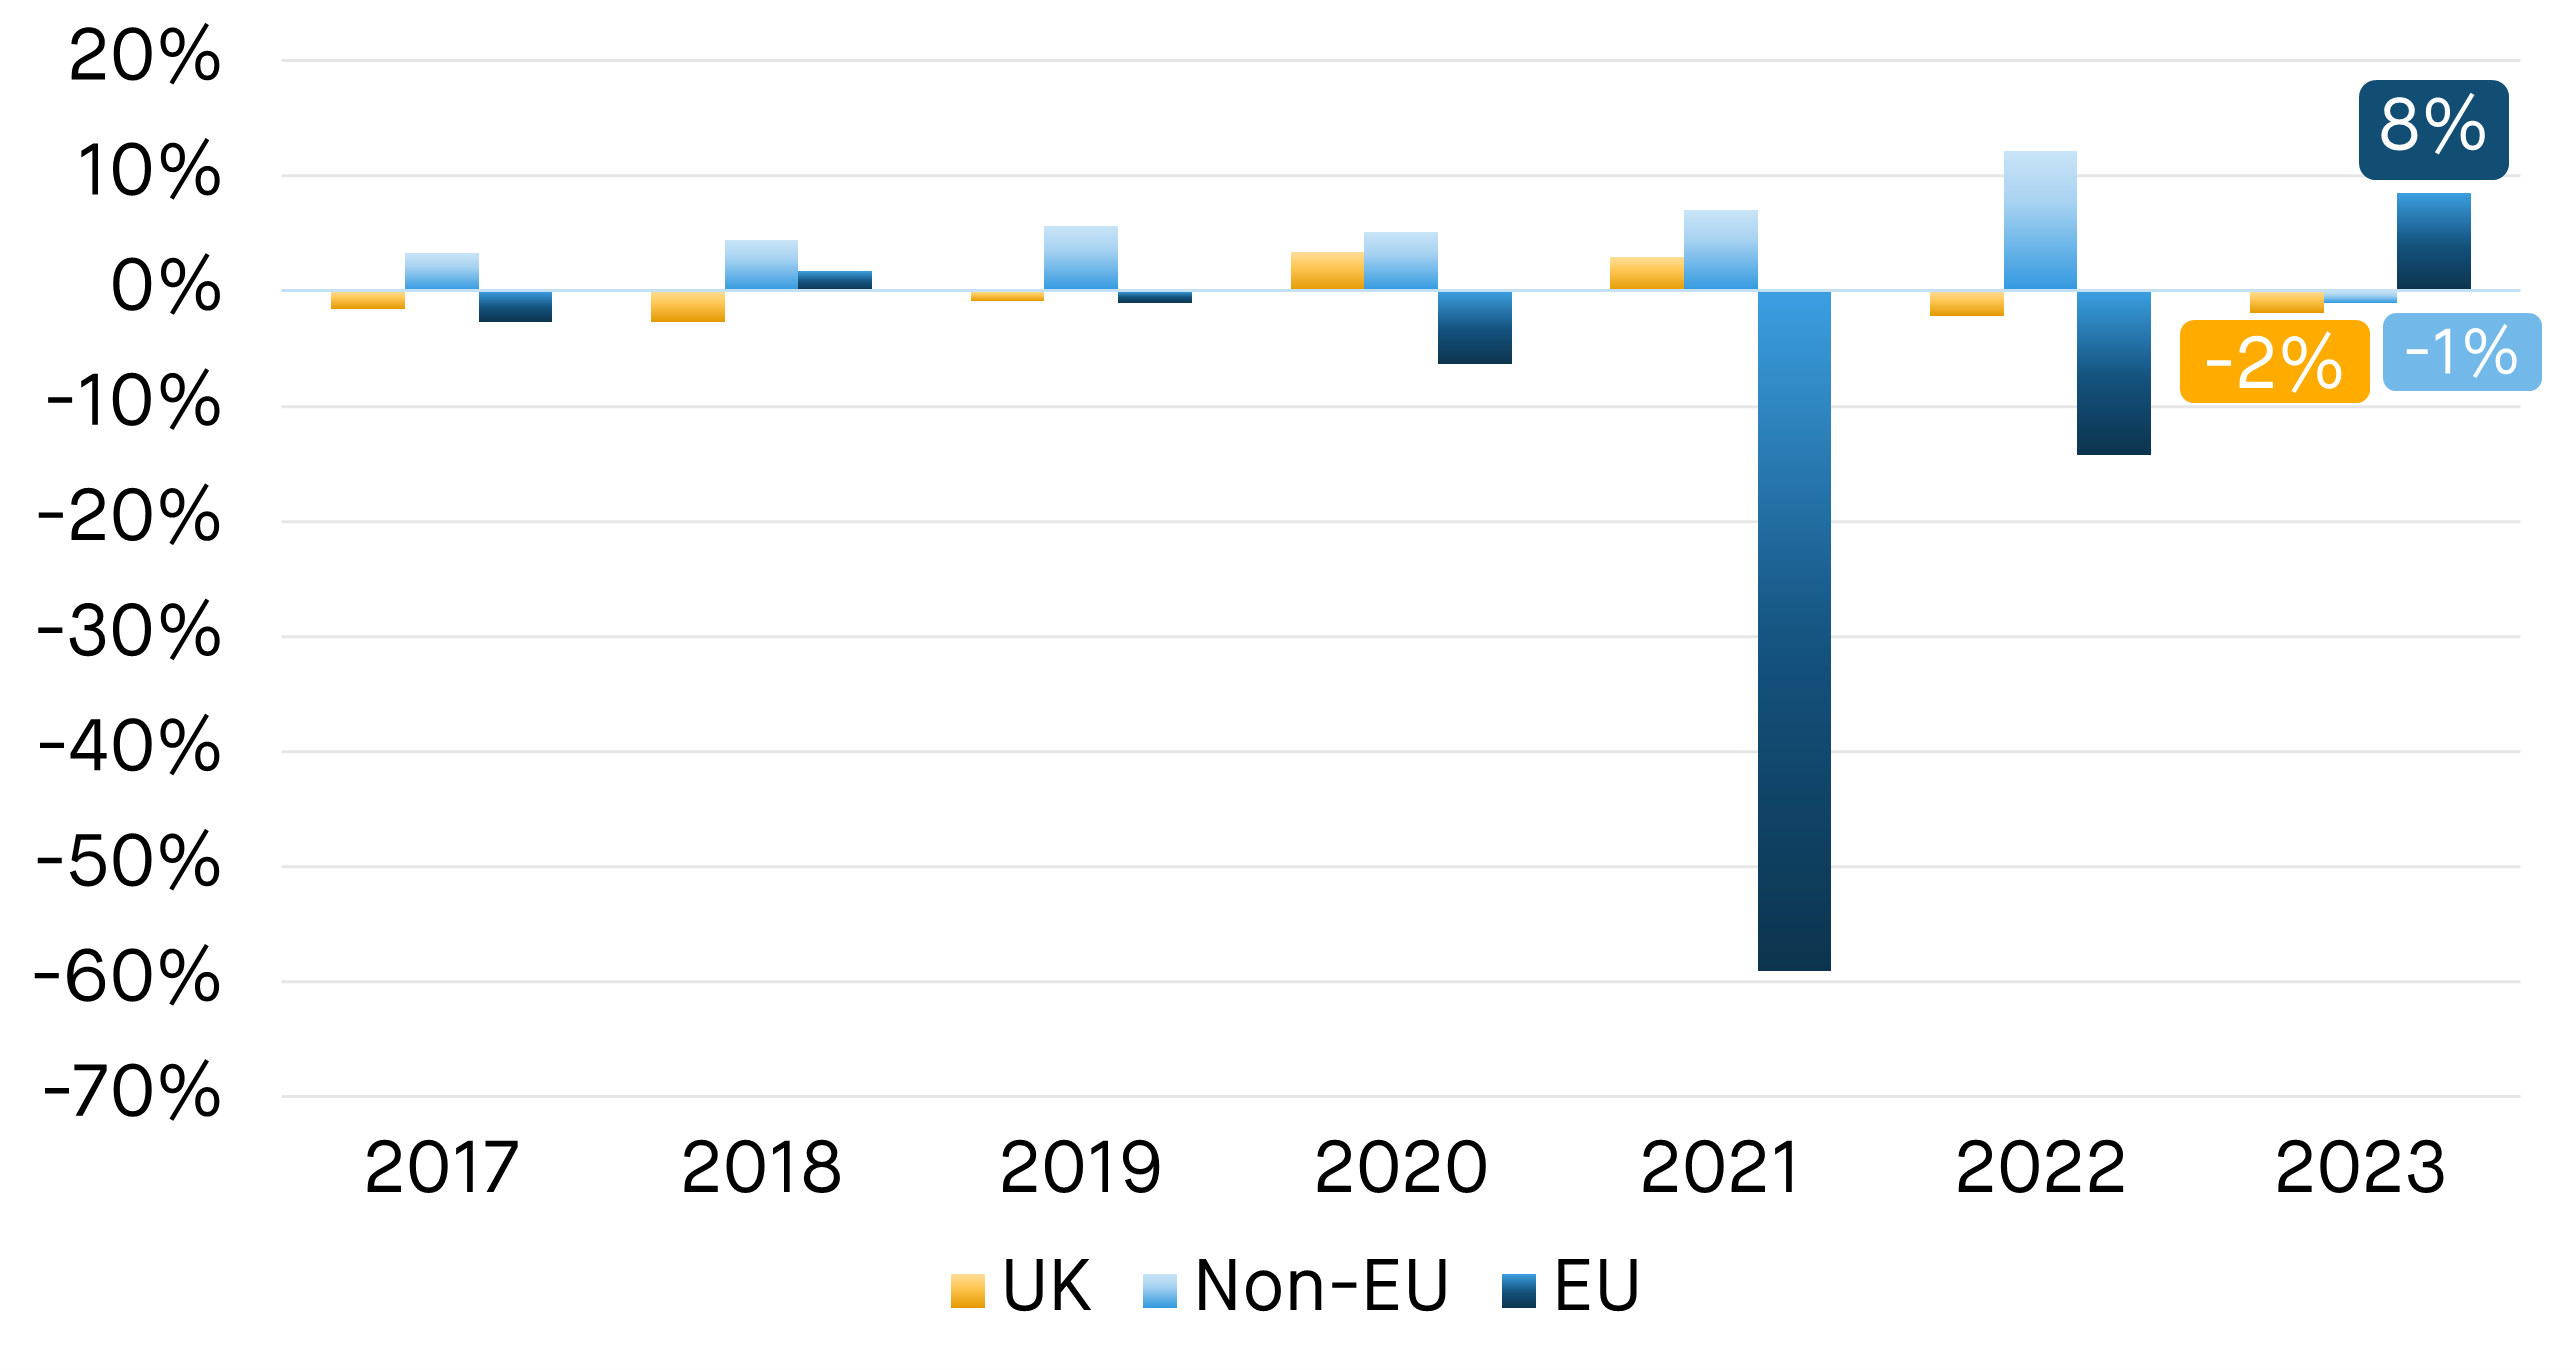
This chart illustrates year-on-year changes in accepted students from each domicile since 2017. Notably, only EU student numbers have increased this year, showing an 8.5% YoY rise. This suggests a potential stabilization post-Brexit, although EU numbers remain below pre-Brexit levels.
Conversely, non-EU student numbers experienced their first drop since 2016, declining by 1.1%. Domestic student acceptances decreased for the second consecutive year, by 1.9% (-8,100 students).
Source: UCAS
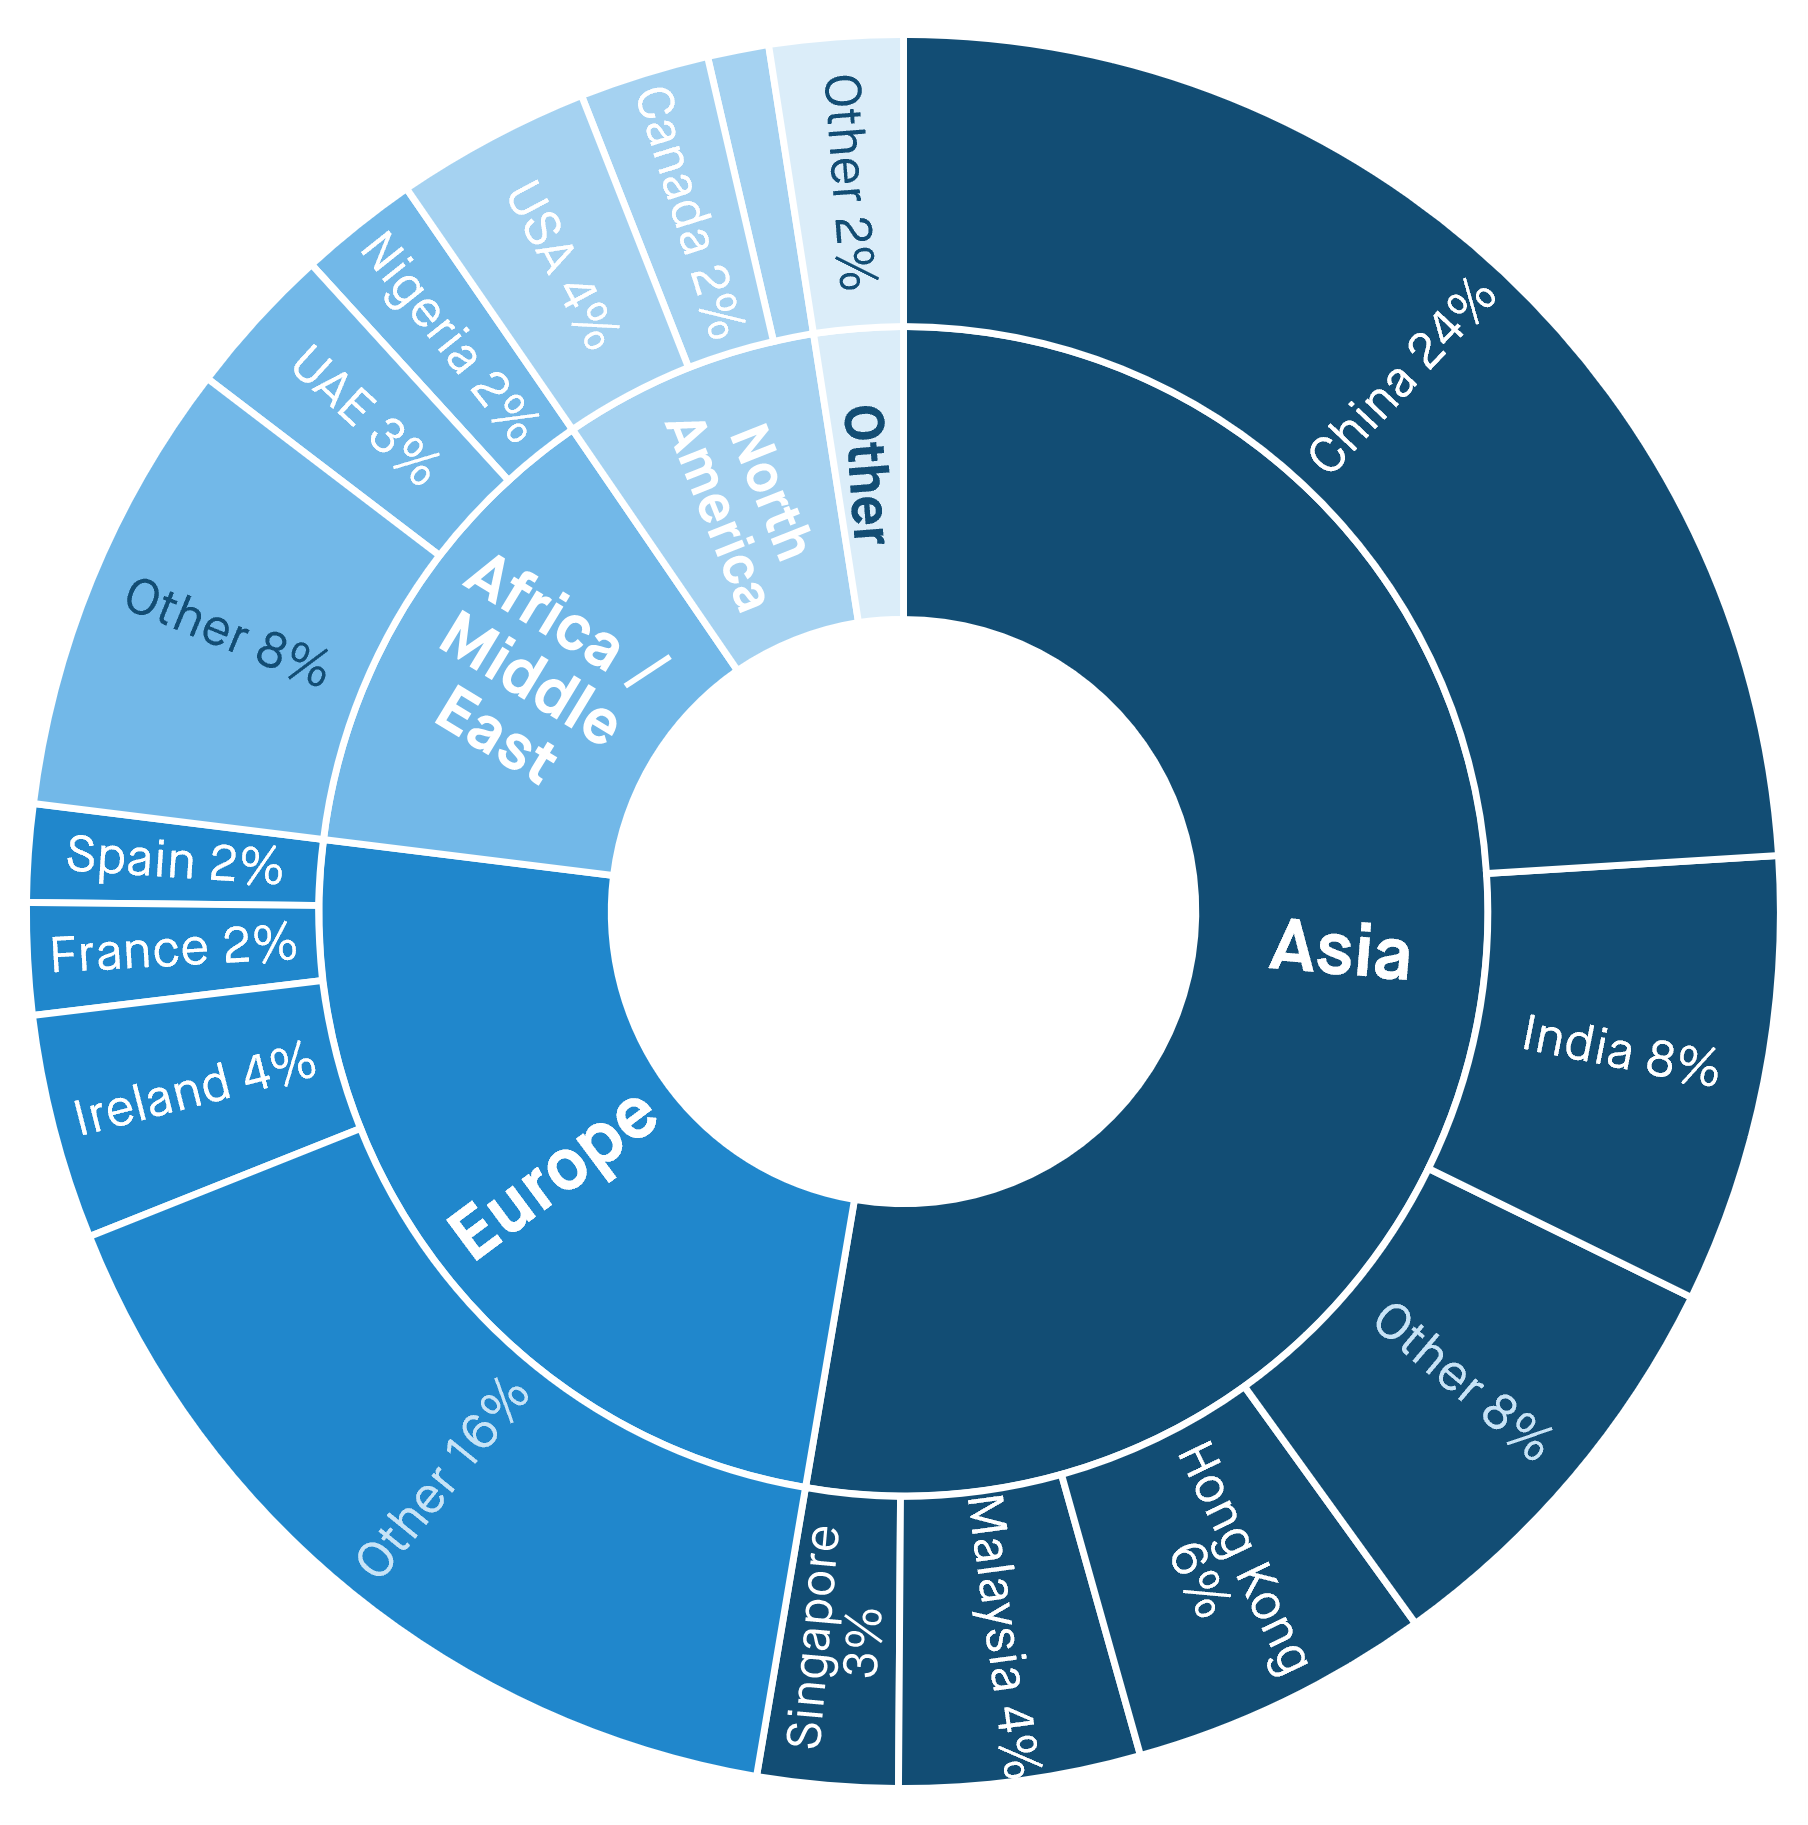
The composition of international accepted students by country is depicted in the chart above. Over 50% of international acceptances originate from Asian countries, with China leading at 24%. Additionally, 24.3% of international acceptances come from other European nations.
Source: UCAS
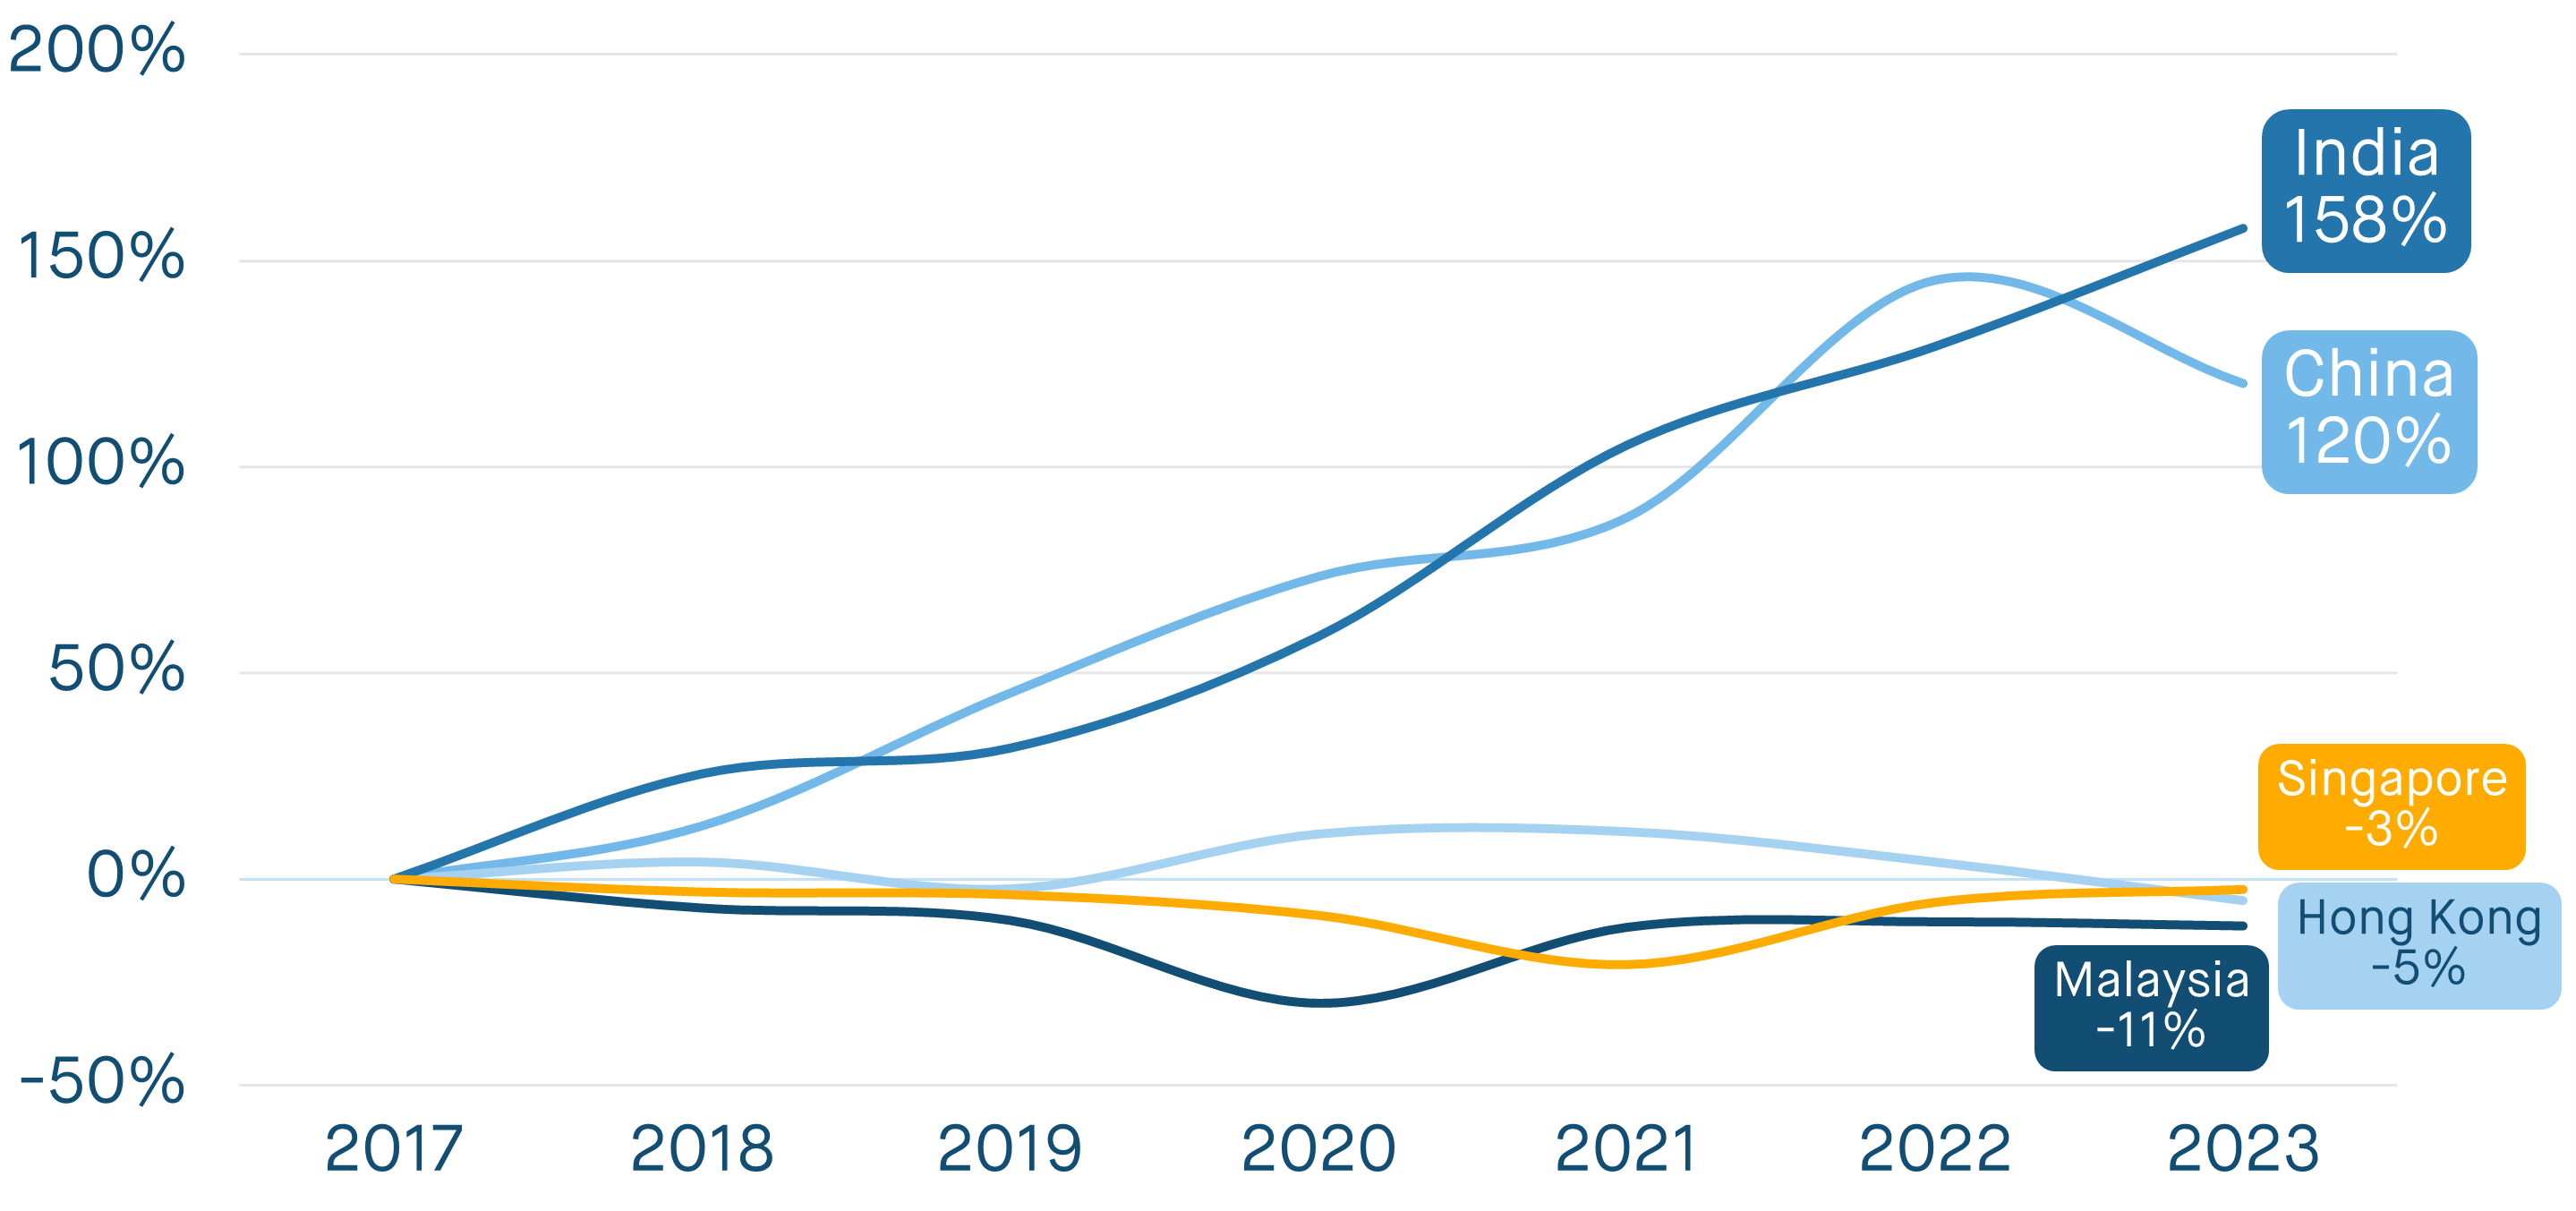
The chart above illustrates how student numbers from the five Asian countries with the highest acceptance rates have changed since 2017.
India and China have both shown significant growth since 2017, jumping by 157.8% and 120.3% respectively. The number of Chinese students accepted to UK universities fell this year by 10%, the only drop shown in the chart. Meanwhile, Indian figures have risen fairly consistently over this period.
Acceptances from Singapore, Hong Kong, and Malaysia have all fallen when indexed against 2017 levels by 3%, 5% and 11% respectively.
Source: UCAS
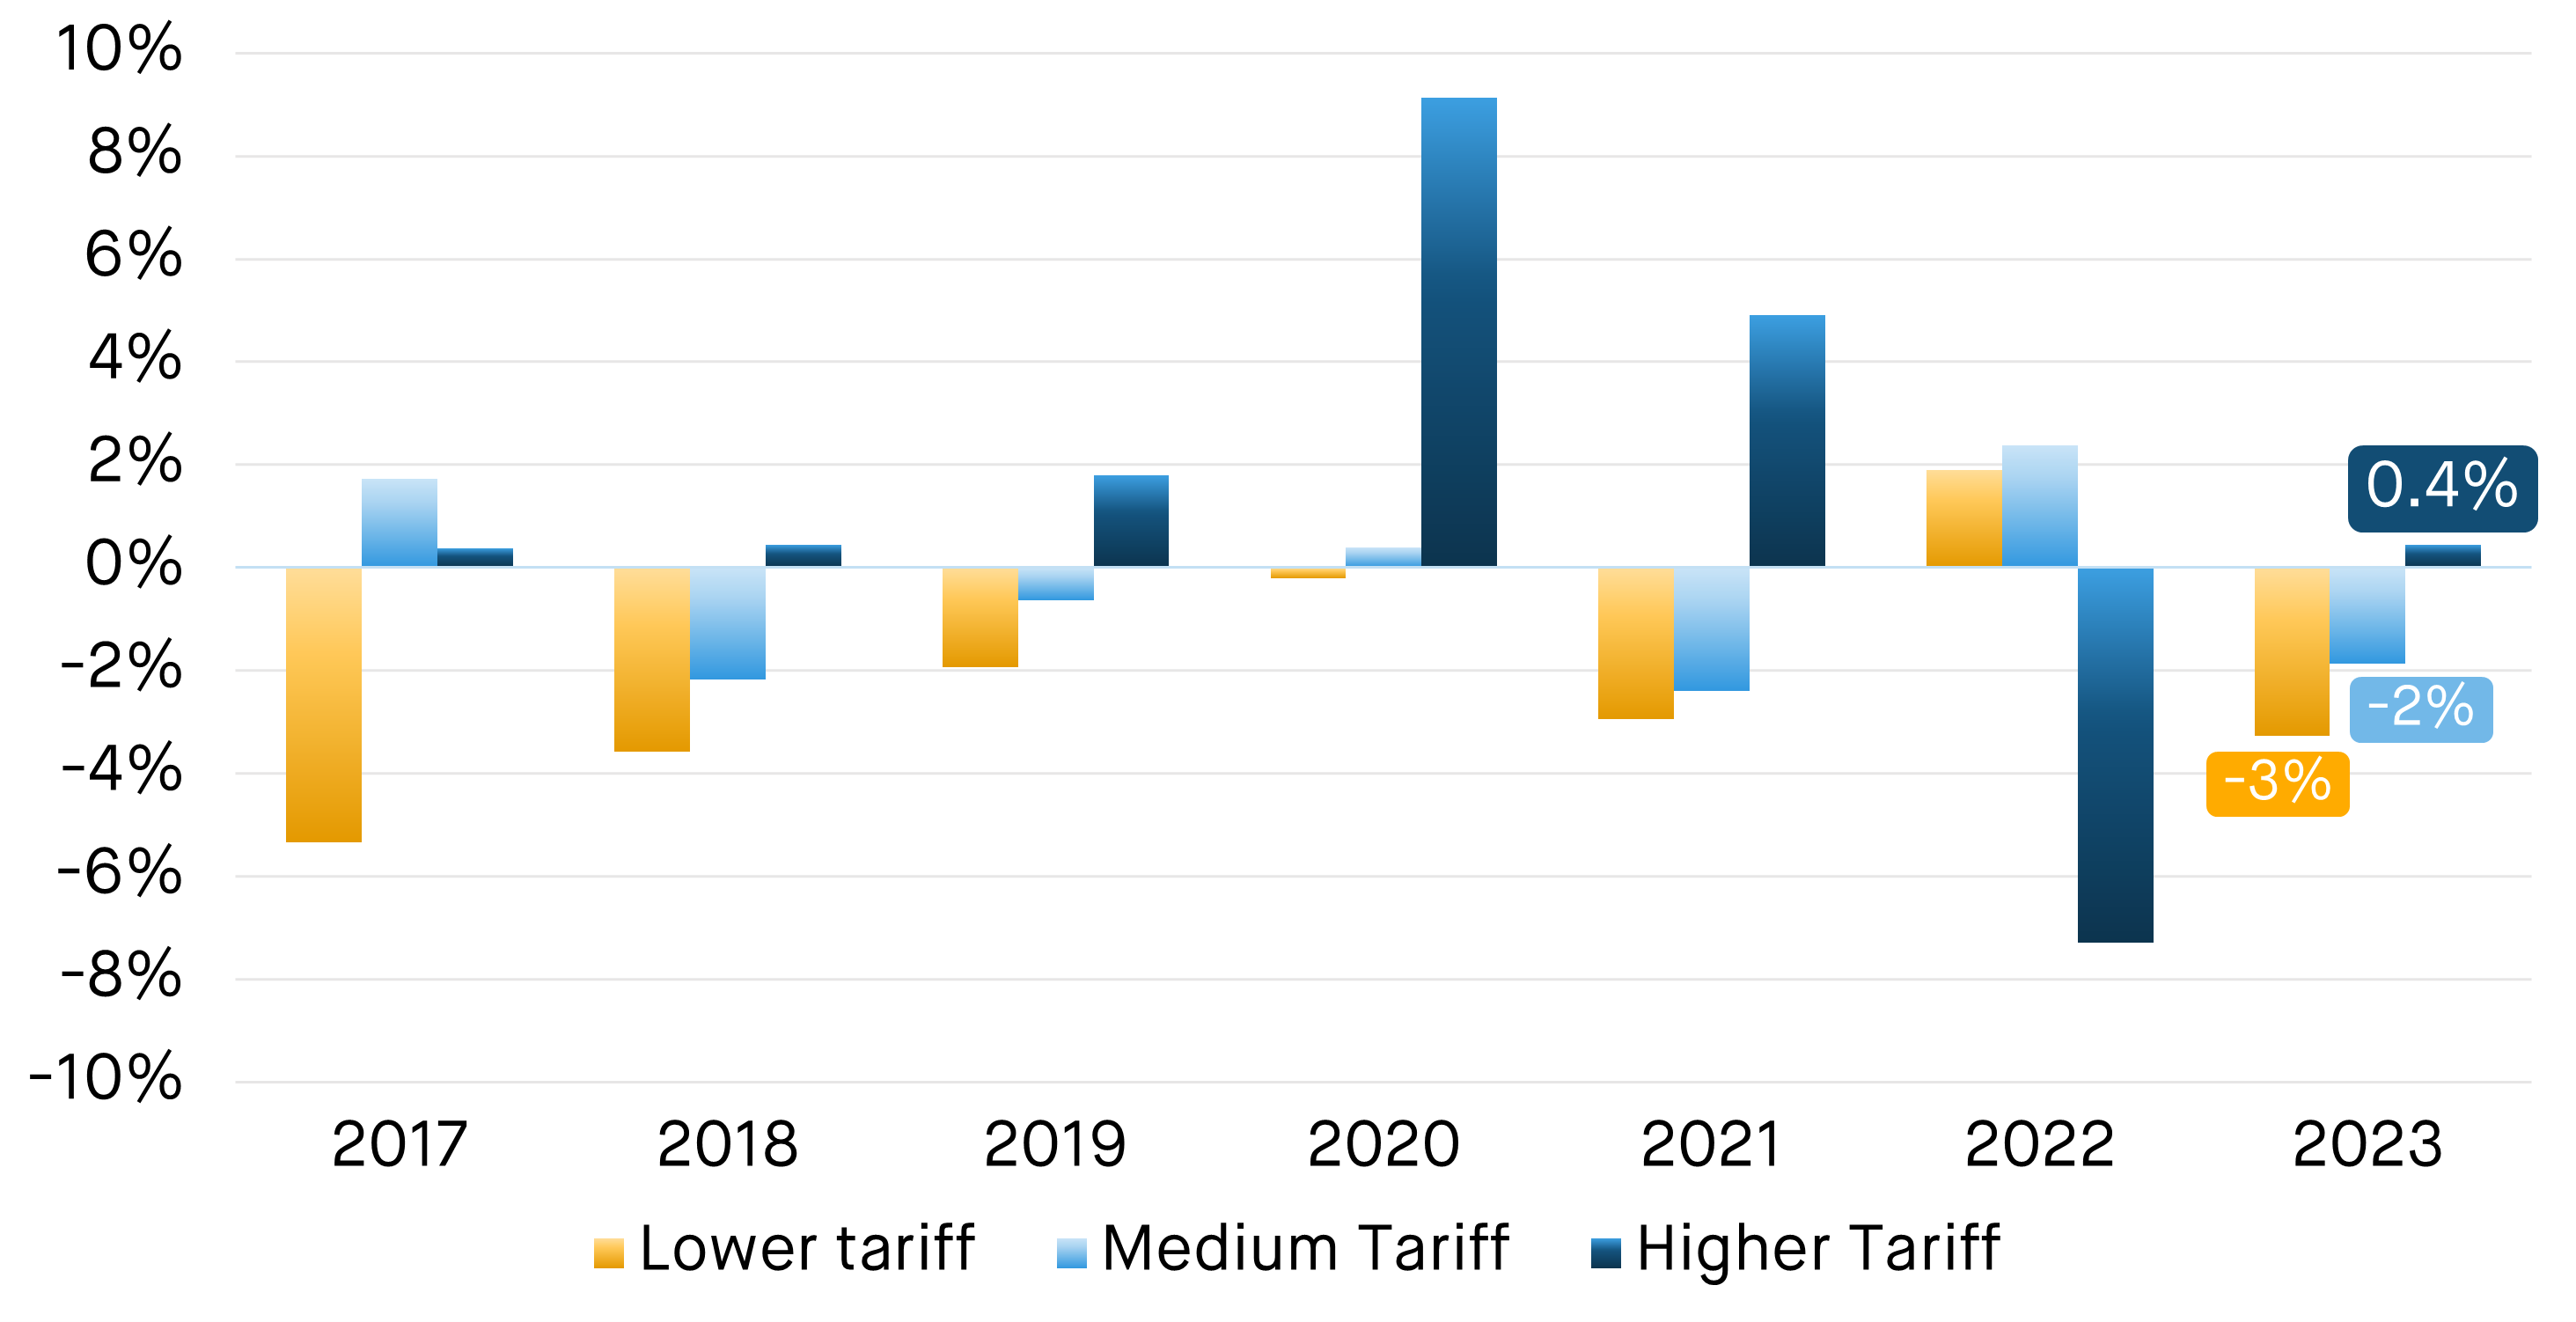
Year-on-year changes in acceptances by tariff provider level since 2017 are demonstrated in this chart.
Both Lower and Medium level tariff providers have so far reported falls in acceptances of 3.3% and 1.9% respectively. Lower tariff numbers in particular have fallen consistently over-time, with the exception of a 2% jump last year. 2023 figures are now 9.7% lower than those in 2017.
Higher tariff institutions experienced a marginal 0.4% increase compared to last year, though they have not fully recovered from a significant drop in the previous year.
Source: UCAS
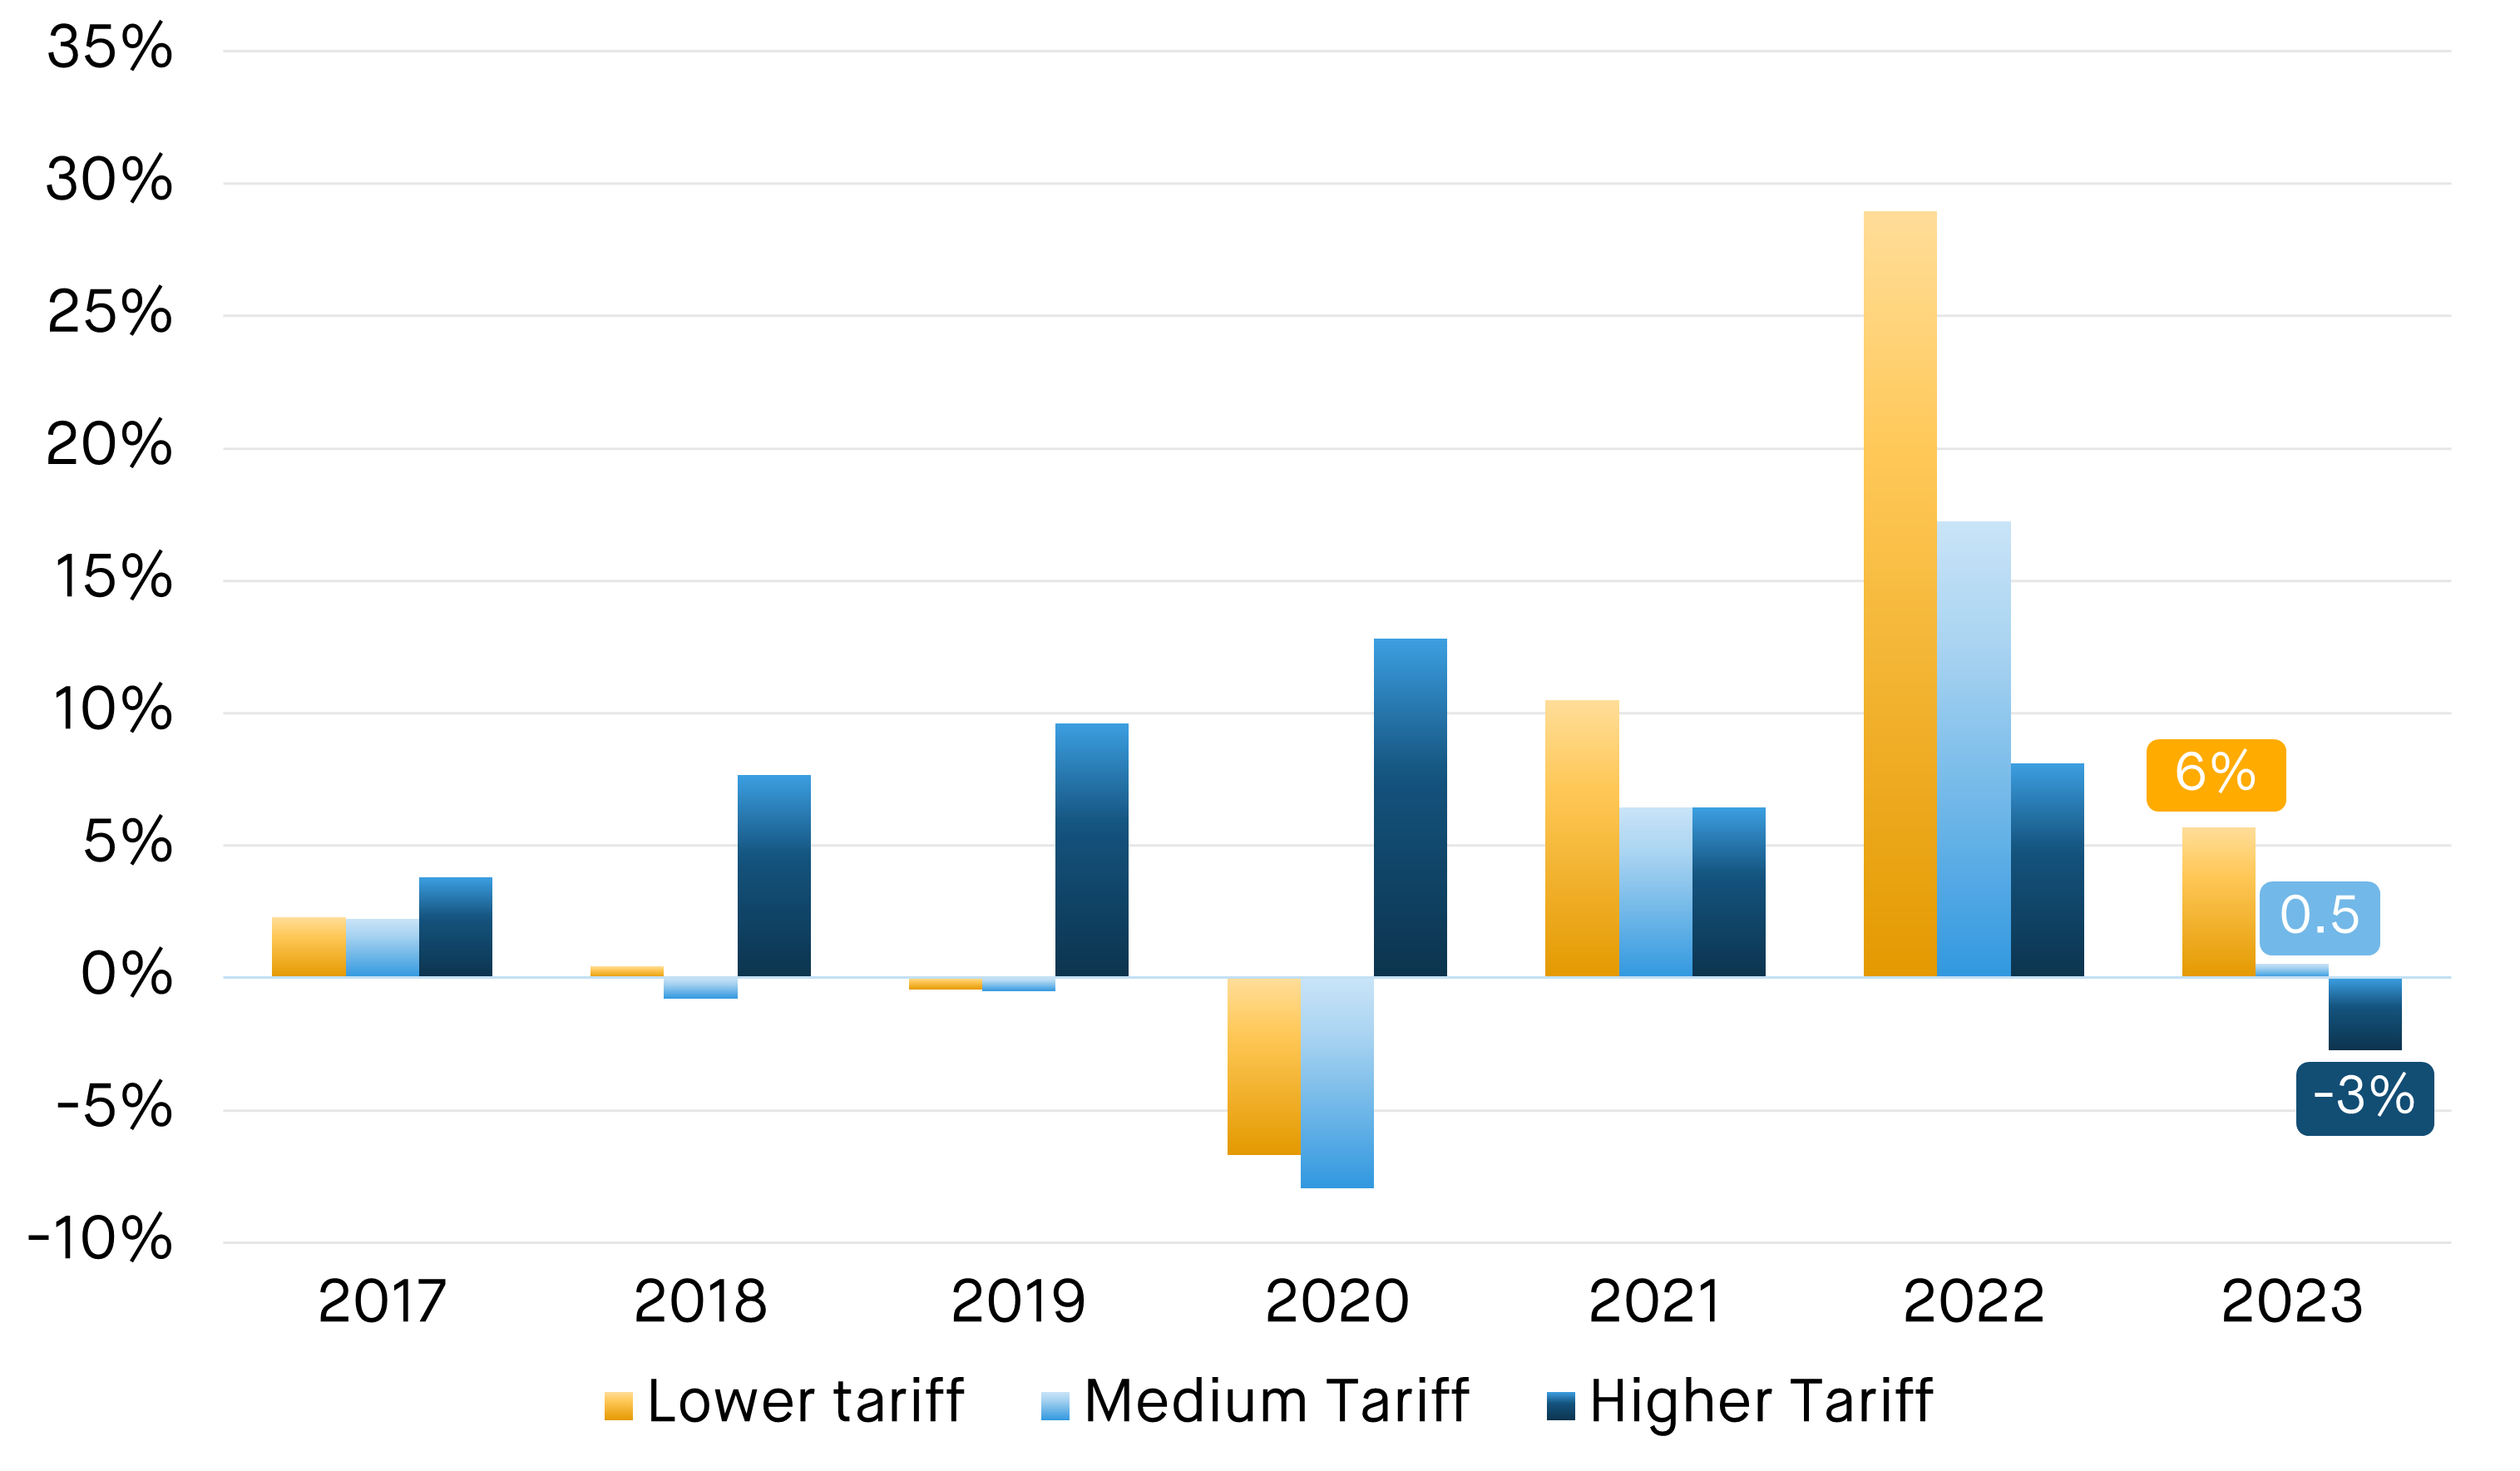
This chart isolates the same data from the previous chart for students coming from non-EU countries. International acceptances to lower-tariff providers have seen a three-year upward trend, rising by 40.5% since 2017. Medium tariff institutions have also witnessed growth, increasing by 0.5% in non-EU student acceptances.
Meanwhile, acceptances to higher tariff providers are down for non-EU students by 2.7%.
The shift in the type of institutions that international students are choosing to study at in the UK is likely related to the change in demographic and make up of those students. For example, the significant increase in students from India shown in the previous chart.
While this data provides valuable insights into the upcoming university student landscape, it is important to note that this could still vary with the final data release for day 28 of the Clearing cycle.
This data, as well as how it will impact the student accommodation market, will also vary significantly by location and institution. It is important to ensure that the most up to date data is considered when making decisions.
For more information about our proprietary, highly granular data covering the UK student accommodation contact the StuRents Research team today. Or book a demo of our Data Portal Data Portal to find out how you can have up-to-the-minute university housing insights at your fingertips.
Share

Article by
Research Analyst at StuRents
Aisling Murphy is a research analyst in StuRents’ research division, StuRents Intelligence.
