
StuRents' Q3 Webinar: Data roundup and latest student accommodation trends

Image courtesy of Flickr
Introduction
We recently hosted our Q3-2025 webinar, presenting the latest trends and insights from the sector alongside a guest presentation from Loc8me founder Raffaele Russo. Here, we roundup some of the key takeaways from the webinar and dive a bit deeper into the latest trends in the student accommodation sector.
Broadly, undergraduate growth is bullish but questions remain over postgraduate trends until more recent data is available from the most recent academic year. The flight to quality trend is still relevant and the competition between and within tariffs is likely to become more intense. There are still big questions around whether the current lettings cycle is lower or slower, with mixed trends both nationally and in individual markets. Planning activity is down year-on-year (YoY), which may provide opportunities for existing assets. Nationally, there is a shortage of supply, although this varies widely at a market-level - with uncertainty of how postgraduate numbers will impact trends.
UCAS acceptances
Looking firstly at 2025 University and Colleges Admissions Service (UCAS) acceptance data, total acceptances are up 2.7% YoY with growth in both UK and EU at 2.6% and 4.5% YoY growth respectively. In keeping with recent trends, EU numbers are down 2.6% YoY and increasingly constitute a smaller percentage of undergraduate students.
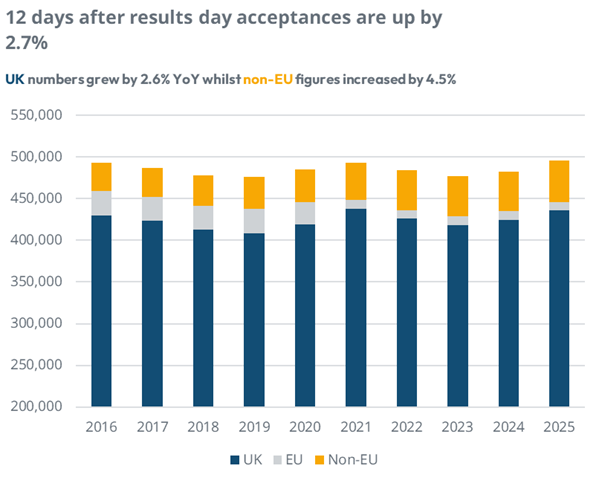
Chart 1: Acceptances by domicile group
Source: UCAS
With UK students, acceptances are up 3.7% YoY, representing a 21% increase on 2019 pre-Covid levels. Entry rates for UK 18 year olds has also stabilised after a dip in 2023, suggesting resilience in demand despite external cost of living pressures. This sustained growth in domestic demand is positive news for HMO and affordable PBSA markets. It is worth noting that for 19-20 and 20-24 year olds, there has been little change in acceptances, with mature student numbers continuing to fall long term.
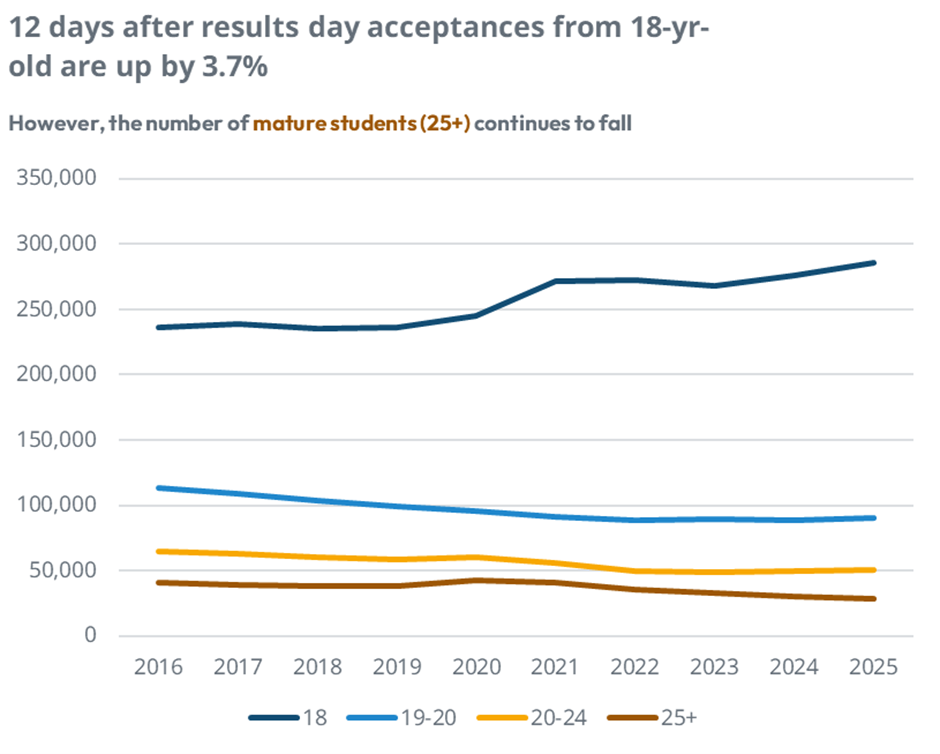
Chart 2: Acceptances by age
Source: UCAS
Diving into international students, Chinese acceptances surged 14% YoY, with numbers up a staggering 63% on 2019 levels. The US is also up 9.6% YoY, while Indian acceptances are down 10% YoY and the notable Turkish growth is slowing. While there is short term volatility, the long term growth is good news for PBSA markets.
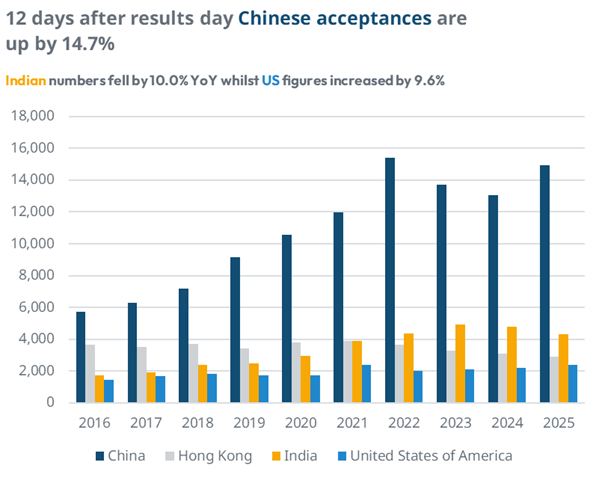
Chart 3: Acceptances by country
Source: UCAS
Turning to acceptances by university tariff, higher tariff institutions now account for 37.7% of all acceptances, which is up 30% from 2016 figures. Middle and lower tariff universities continue to lose share, reinforcing the ‘flight to quality’ trend. This is likely to increase competition among higher tariff institutions, and add further pressure on middle and lower tariff providers to stabilise numbers and reverse this trend.
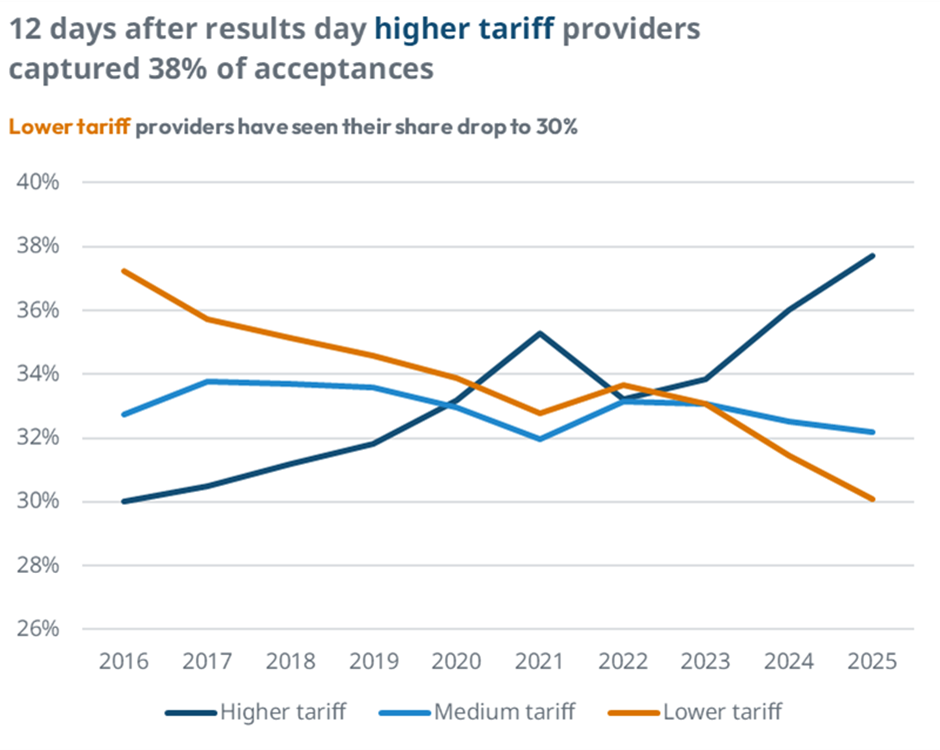
Chart 4: Acceptances by university tariff
Source: UCAS
While overall this data looks positive, questions still remain around recent postgraduate numbers. The 2023 figures from the Higher Education Statistics Agency (HESA) indicate that around half of international students are postgraduates, so undergraduate data can only provide part of the story. The 2024 Office for Students (OfS) data suggests double-digit decline in postgraduate students, so the final trends are yet to be seen.
PBSA occupancy
With occupancy, using data from the StuRents Occupancy Survey, figures for this academic year have generally been down YoY for most markets, but there are signs of recovery.
For studios, our data indicates that nationally they are 66% full as of July, down from 77% at the same point in the cycle last year. However, leasing results have improved since May; the key question still remains whether the current cycle is truly lower, or whether savvy students are waiting longer to book.
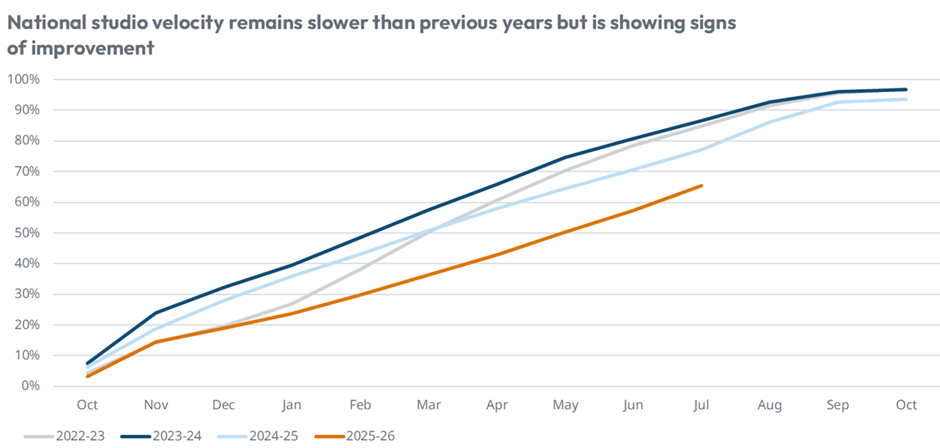
Chart 5: Studio leasing velocity and occupancy
Source: StuRents Occupancy Survey
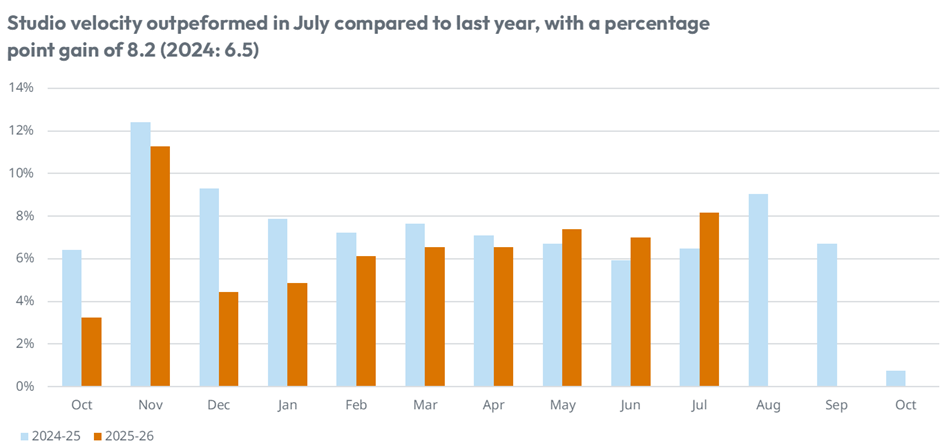
Chart 6: YoY change in studio leasing velocity and occupancy
Source: StuRents Occupancy Survey
Cluster accommodation is also at 66% occupancy as of July, the same figure as this point in the previous cycle, and on the whole has been tracking last year’s trend closely. Again, there has been stronger leasing indicators in recent months - as with studios, trends could change as the cycle closes, but there is reason to be cautiously optimistic.
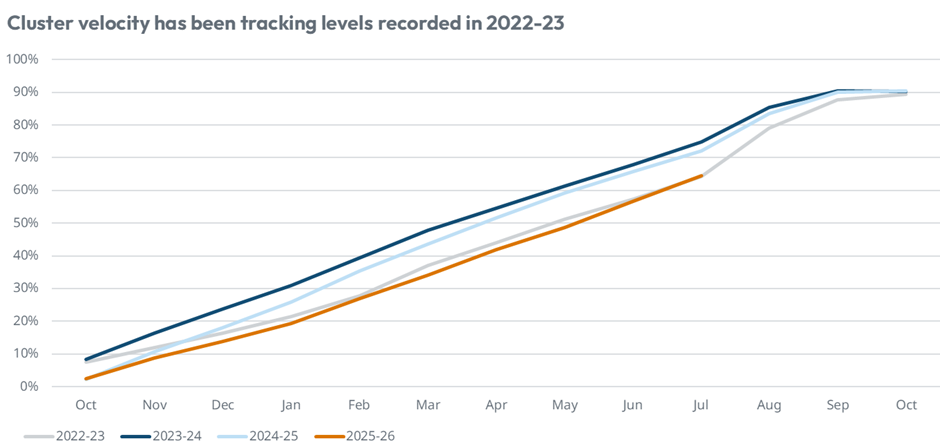
Chart 7: Cluster leasing velocity and occupancy
Source: StuRents Occupancy Survey
Student Behaviour
Taking data from the StuRents marketing and listings platform, searches are increasingly focused on smaller accommodation sizes, with searches for 3+ beds at 42% and down from 60% last quarter - a typical and expected shift at this point in the cycle.
Using pricing data from StuRents Intelligence and executed tenancy from Concurrent, for domestic students there has been notable HMO rental growth of 4.5% YoY, outpacing PBSA which stands at 2.9% YoY. However, as we’ve discussed previously, headline rents are only part of the picture when assessing market growth. Shorter tenancy lengths mean that YoY growth in total contract value is more modest, particularly for PBSA at 1.8% compared to HMO at 4.4%.
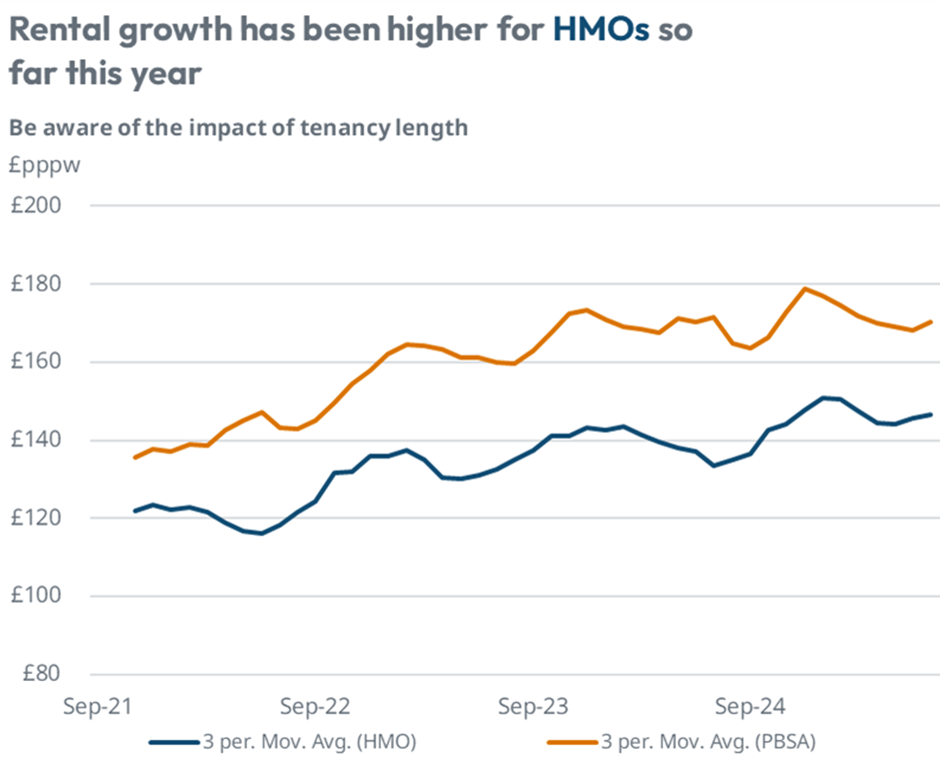
Chart 8: HMO and PBSA rents for domestic students
Source: StuRents Intelligence, Concurrent
For Chinese students, headline rents are up 4.2% YoY for HMO and 2.9% for PBSA, which is very similar to that seen for domestic students. However, over 80% of Chinese signatories are choosing PBSA over HMO. Again, shorter PBSA tenancy lengths are resulting in lower contract values compared to last year. Therefore taking tenancy lengths into consideration, there is 2.5% growth in total contract value, compared to the 2.9% growth in headline rents.
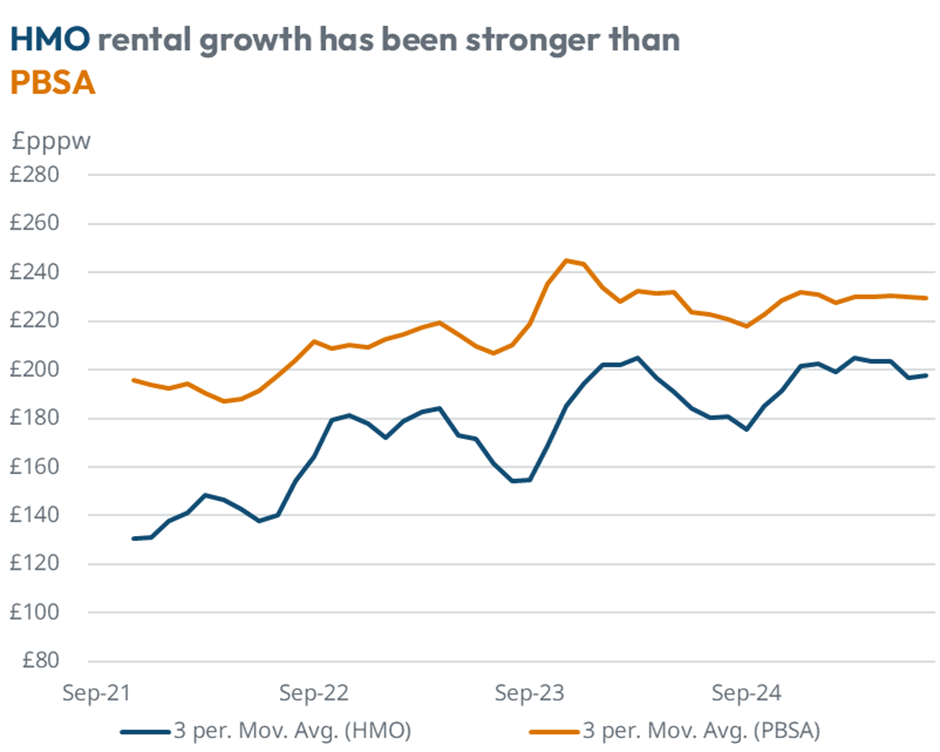
Chart 9: HMO and PBSA rents for Chinese students
Source: StuRents Intelligence, Concurrent
Planning
Nationally, planning activity has slowed once again, with submitted beds down 44% and approved beds down 39% in the first half of 2025. Several factors including high construction costs, local market dynamics, and regulatory pressures are continuing to constrain future supply. This poses challenges for developers, investors and lenders, as well as students in undersupplied markets, but similarly supports performance and opens opportunities for existing assets.
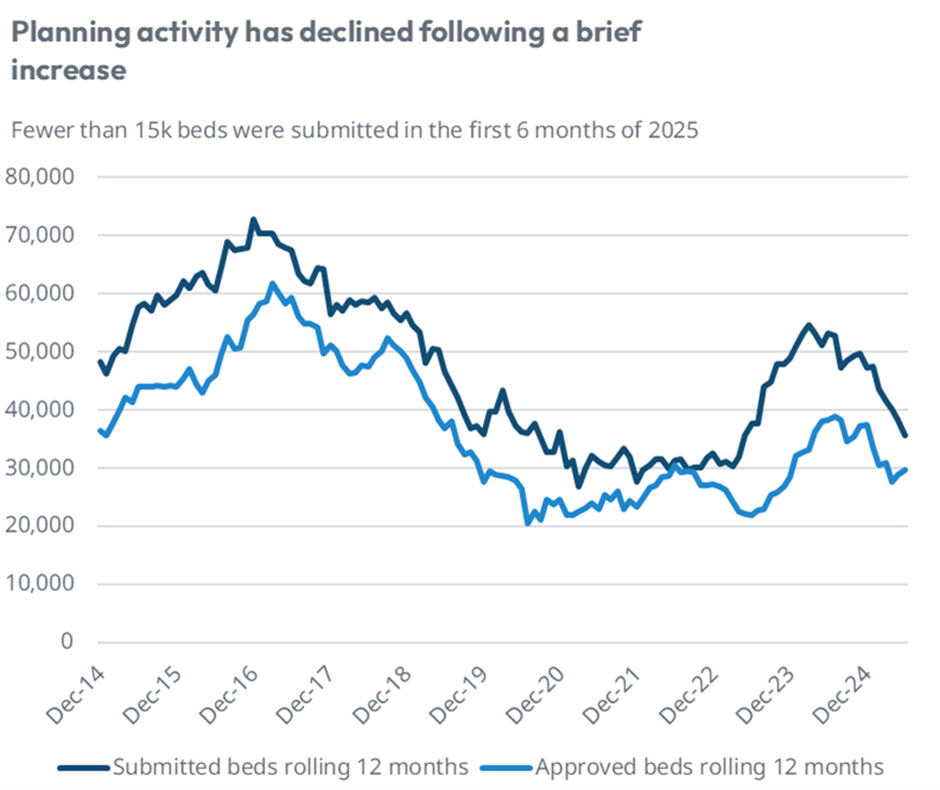
Chart 10: Submitted and approved beds over time
Source: StuRents Intelligence, Local Councils
Manchester, London and Bristol lead in planning submissions, with the top 5 cities equating to 70% of beds submitted nationally. However, delivery risk remains high, with typically 40% or less of submitted beds ever hitting the market. If regulatory and cost pressure continues to mount, we could see not only a drop in submissions, but an additional decrease in approvals and deliveries as planning applications stall in the process or are rejected.
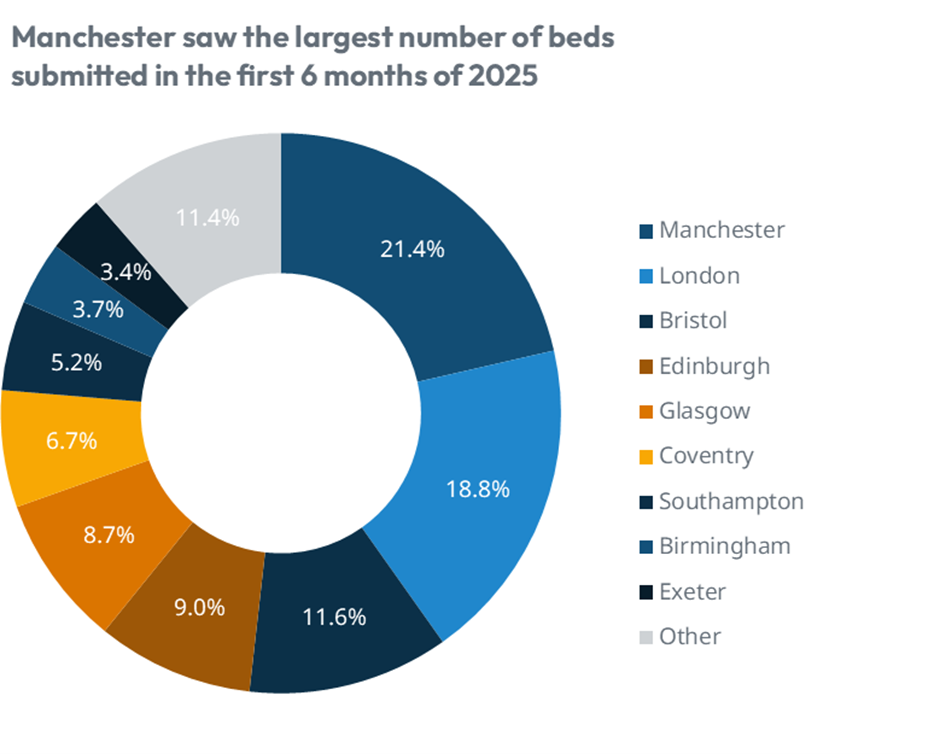
Chart 11: Beds submitted by city
Source: StuRents Intelligence, Local Councils
Supply and Demand
Across the UK, the supply and demand gap for student accommodation remains (assuming a 40% delivery rate of pipeline beds) and could potentially narrow if demand stalls in the next few years. However, demand growth of just 2% per annum could see the spread widen, indicating further pressure in the markets and competition for beds.
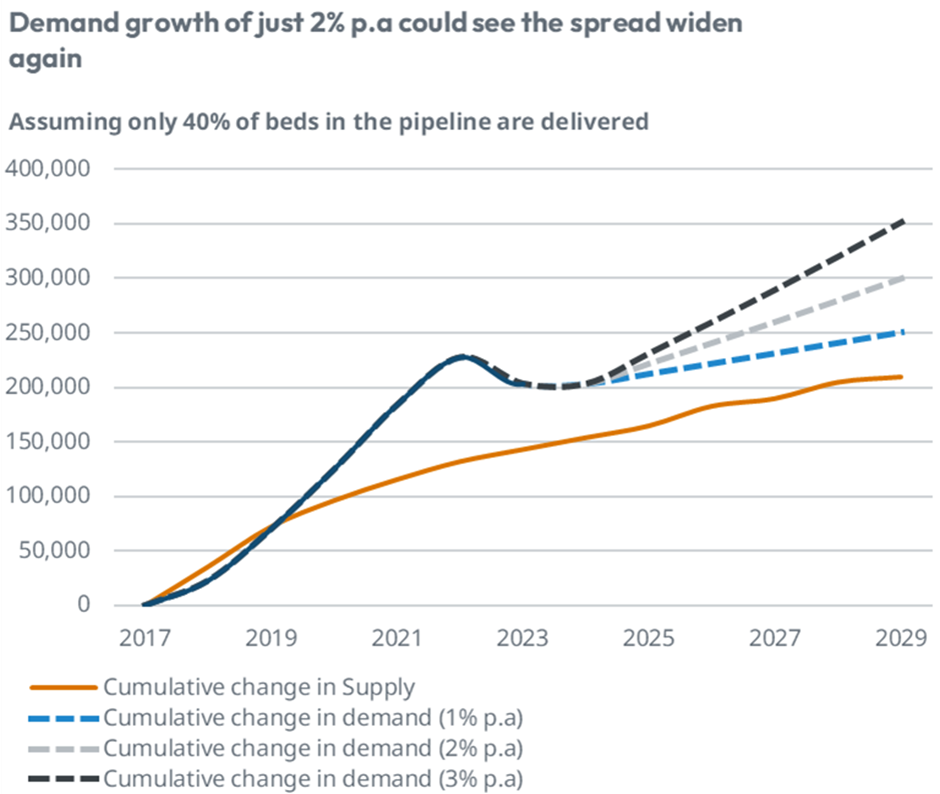
Chart 12: National supply and demand outlook
Source: StuRents Intelligence
Note: Assumes no growth in demand for 2024. Pipeline assumes 40% of beds are delivered and 20% of returning British students choose PBSA. Excludes London.
As we’ve previously highlighted, national metrics and student-to-bed ratios obscure city or intra-city level trends - and assumptions around addressable market can also easily overestimate demand. While some cities are indeed facing shortages, others are experiencing a surplus of beds due to a surge of planning activity that outpaced growth. Others are in flux, with difficulties expected in contract growth and occupancy in the coming years.
Additionally, current student numbers are always uncertain, and require a combined view of multiple data sources to inform forecasts.
For more information about our proprietary, highly granular data covering UK student accommodation contact the StuRents Research team today. Book a demo of our Data Portal to find out how you can have up-to-the-minute university housing insights at your fingertips, or get in touch with us about our Occupancy Survey.
Share

Article by
Research Analyst at StuRents
David Reader is a research analyst in StuRents’ research division, StuRents Intelligence.
