
Predicting supply vs demand growth in student accommodation

Image courtesy of Flickr
Predicting supply vs demand growth
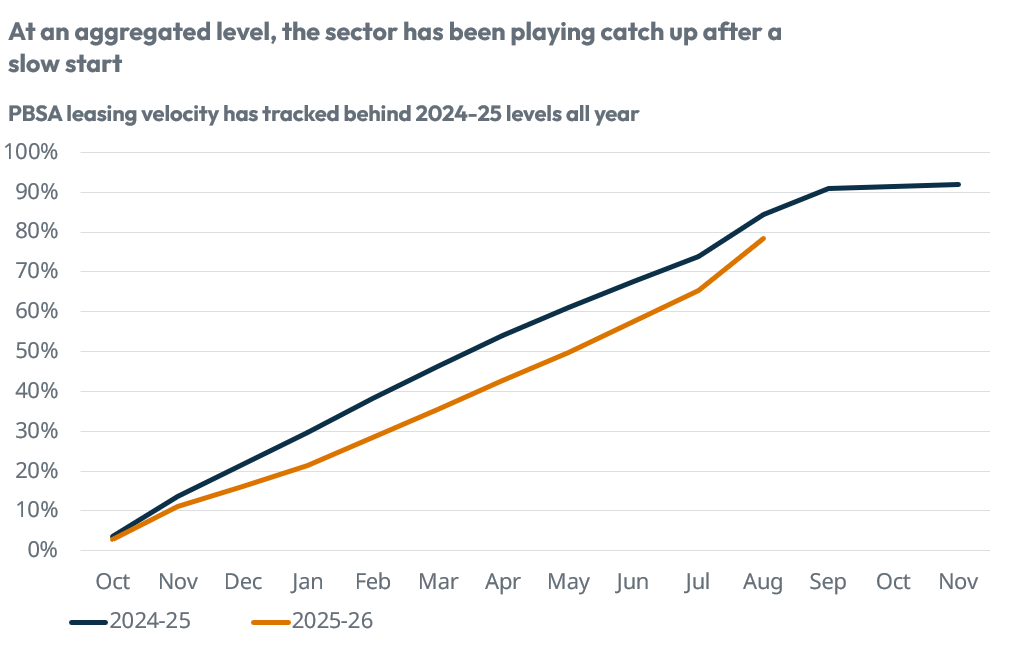
At our latest industry roundtable, it was recognised how hard this lettings cycle has been compared to previous years. Whilst the challenges an individual operator may have faced will be hugely dependent on the locations they are operating in, as well as the product fit in that market, our own Occupancy Survey also confirms this year's slow leasing cycle.
So, with many commentators still reporting structural undersupply and sector data from the likes of UCAS showing continued applicant growth, it begs the question: What is really going on?
While there will be caveats to any analysis trying to paint a picture of supply vs demand, partly due to the availability and accuracy of industry data, an objective view can still be helpful in understanding historic and future performance.
UCAS acceptance growth
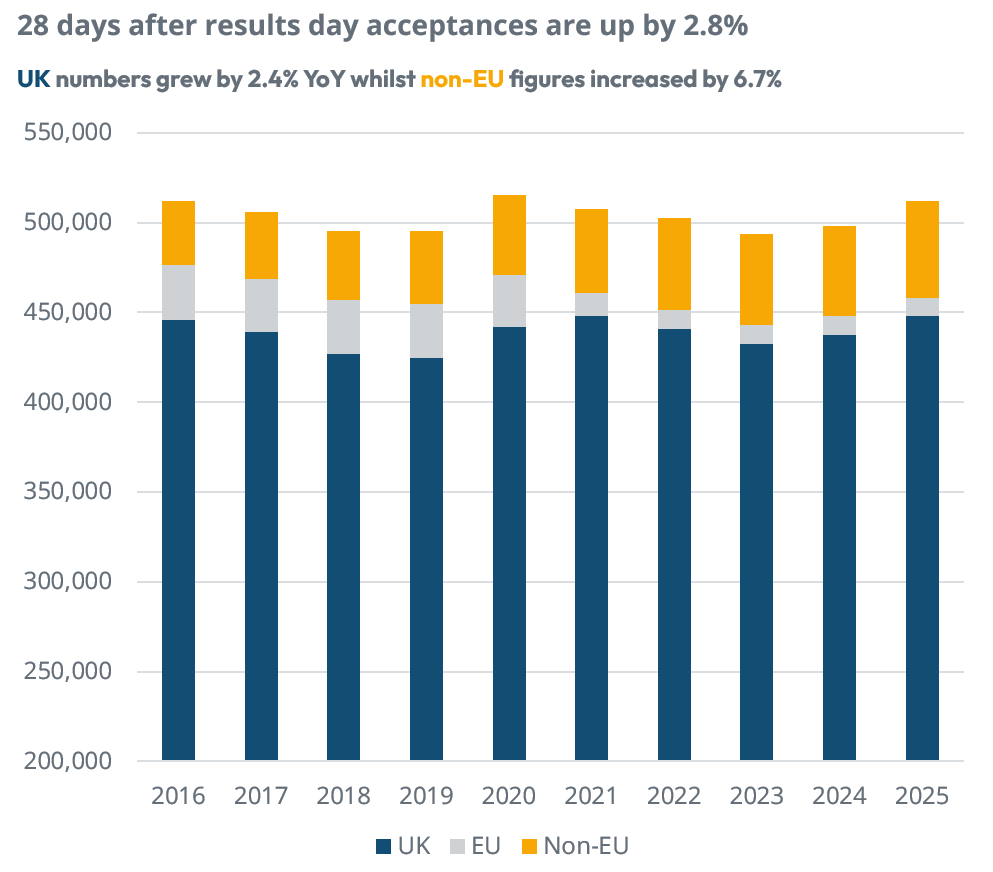
Let's start by considering headline data from UCAS following clearing.
Total yearly acceptances grew by 2.8% to 512,270. At a domicile level, acceptances from UK students were up by 2.4%, while non-EU figures jumped by 6.7%. The position 28 days after results day was therefore mostly positive.
Source: StuRents, UCAS
Isolating specific countries of origin, all important Chinese growth also returned, with yearly acceptances jumping by a significant 19.8% following more recent declines (2024: -1.9%). The most notable theme was one of growth divergence, with higher tariff providers reporting an increase of 8.1% in total acceptances, while non-EU numbers at these providers jumped by 13.7%. This compares to lower tariff providers, where figures fell by -1.8% and -11.9% respectively. So on face value, nationally, undergraduate demand still looks bullish even if there are significant local variations.
The impact of postgraduates
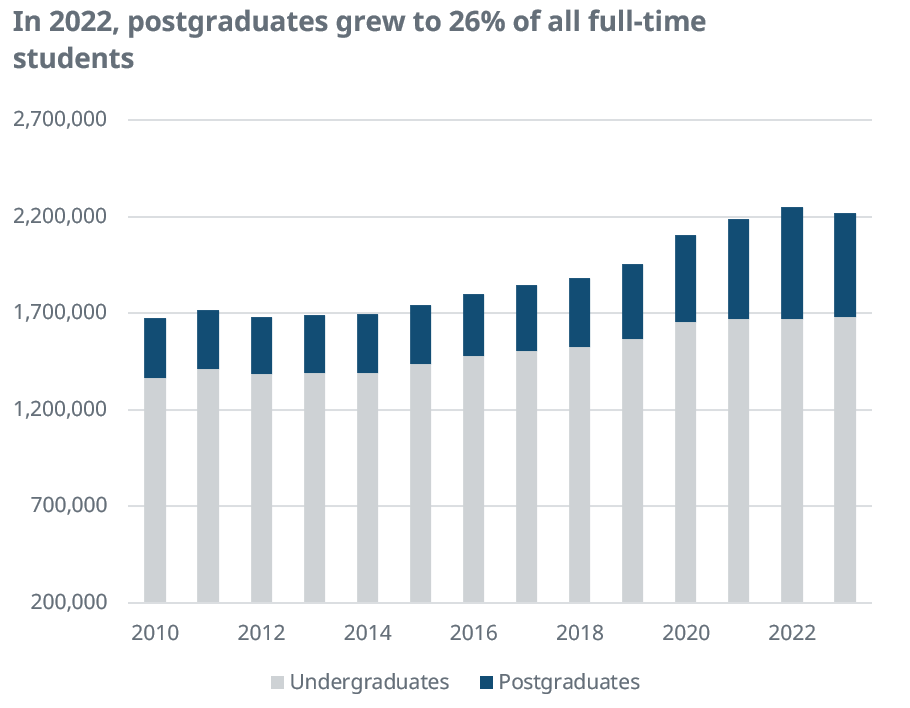
In recent years, postgraduates have become an increasingly important cohort. While the lack of timely data from HESA is well-reported, it does show how this student group grew from less than 19% share in 2018 to ~26% in 2022. What’s more, most of this was attributed to international (non-EU) growth, with numbers increasing by >220k during this period. Total undergraduates over the same period grew by ~144k.
Source: StuRents, HESA
In light of a lack of 2024 and 2025 figures, we can leverage other sources, such as the Office for Students (OfS), to understand how these stats may have changed more recently. Whilst not perfect, this does then allow us to more accurately assess why the market has seemingly become tougher.
OfS indicators
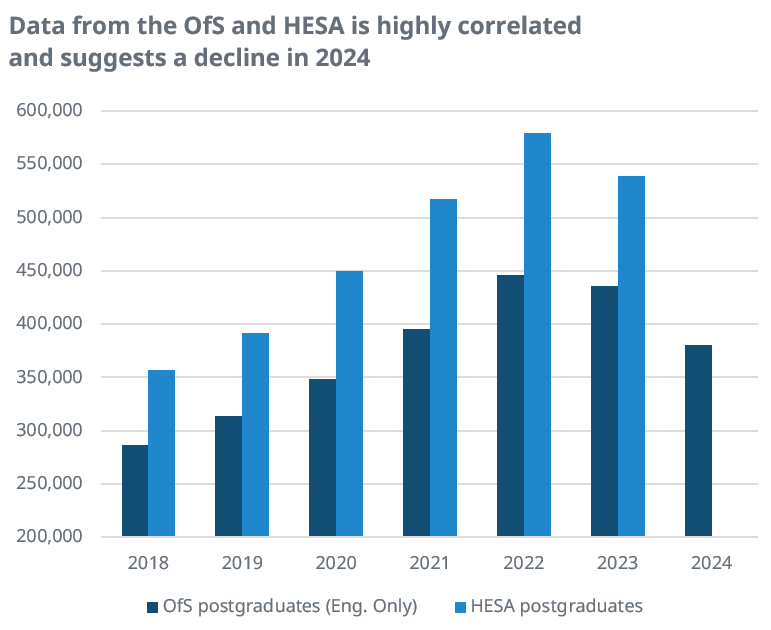
Data from the Office of Students also has its limitations though. Covering England only, the data is defined as early estimates, so it does not represent the final full-time student population. However, it does appear to be highly correlated to HESA, helping to provide an indication of how trends have developed since the latest reported year.
The data indicates a decline in postgraduates of 13.0% in 2024, with overseas postgraduates dropping by 17.4% year-on-year. If it's assumed figures return to the long-term, pre-Covid trend, then a further fall in 2025 could also materialise.
Source: StuRents, HESA, OfS
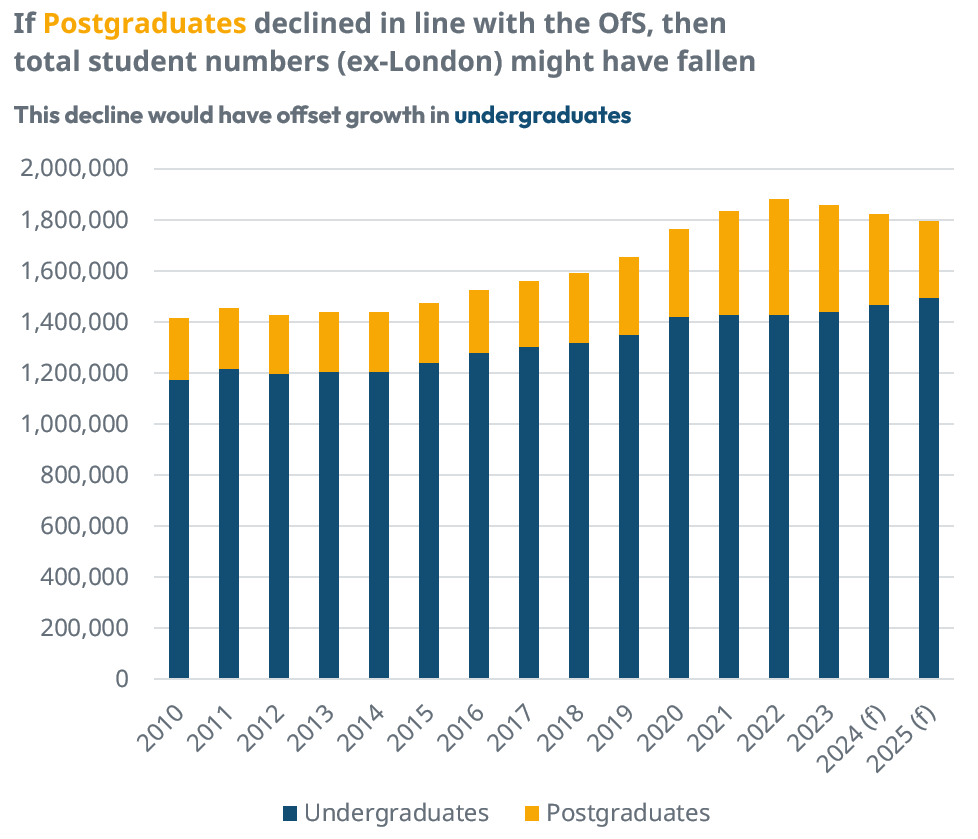
On this basis, if we apply these percentage declines to HESA figures but assume growth in undergraduates in line with UCAS, we start to get a very different picture of total full-time students. In 2024 and outside of London, full-time students on this basis would be down by ~1.9%, followed by a further fall of ~1.4% in 2025.
Source: StuRents, HESA, OfS
The impact on supply vs demand
While student-to-student ratios are still widely reported, our view is that these do not provide an accurate measure of demand for PBSA for a number of reasons, which we outlined here. Its main flaw is the belief that all students want to and can afford to live in PBSA, which is proven to be false.
Measuring changes to demand for PBSA and how this compares to changes to supply can provide a more accurate picture as to whether a market is likely to improve or deteriorate.
Looking at the national picture outside of London and taking the view that postgraduates may have declined further, as indicated by the OfS, more recent fundamentals look very different.
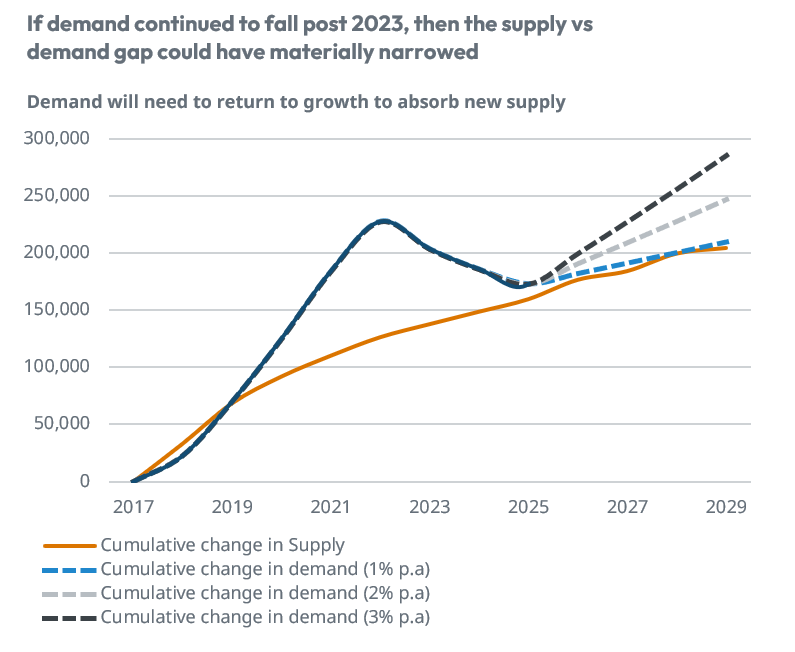
The spread between supply and demand ballooned post-COVID, resulting in extremely strong leasing performance and double-digit rental growth. However, this was not sustained, and analysis based on the above now suggests figures in 2025 are closer to those reported in 2018 or 2019.
Source: StuRents
Supporting this view is our own proprietary occupancy data, which reflects the harder market conditions reported over the last 12-24 months, with slower leasing and a much more competitive environment where incentives are heavily used to fill beds late in the cycle.
Source: StuRents Occupancy Survey
As such, expectations for rental growth this year are also more muted at 2-3%. However, it's worth bearing in mind that this is closer to the long-term average rather than the extravagant growth some have reported in recent cycles. Looking ahead, the analysis highlights the importance of continued demand growth in the face of increasing PBSA supply. Positively, demand growth of just 2% p.a. could lead to a widening of fundamentals, highlighting how quickly market conditions can swing in either direction. Of course, it's also worth reiterating that every location is unique, and our city-level analysis of fundamentals updated monthly and available via the StuRents Data Portal clearly demonstrates this.
Demand excludes live-at-home students and 80% of returning domestic students, who are more likely to choose HMO accommodation.
Other forms of accommodation and the Live at Home impact
While analysis such as this can be critical in understanding changing fundamentals, both nationally and at a city level, it’s important to recognise its limitations due to the availability of data.
A lack of up-to-date data on the proportion of students living at home remains an area for improvement. Whilst, indicatively, this has been increasing, the delays to HESA and questions over its accuracy leave a certain level of uncertainty, which can impact any conclusions drawn.
Similarly, build-to-rent and co-living have been gaining much attention and the impact on demand for PBSA certainly reared its head in the last few years, with cities such as Leeds being a key area of focus. There is no doubt that a proportion of students are deciding to live in these types of accommodation. However, with anecdotes suggesting the proportion living in a particular scheme can range from single digits to 100%, it becomes extremely difficult to quantify its impact both now and in the future. This means broad assumptions must be made, which can swing any sensitivity analysis.
Finally, we haven't even dived into the specifics of local product fit, demographic make up, the impact of the micro location, and more. All of these factors can impact the likely success of a scheme. The last few years in particular have shown the importance of high quality, truly independent data. This is a trend which is only expected to continue as the sector moves from alternative to the mainstream and the importance of data-based decision-making comes even more to the fore.
For more information about our proprietary, highly granular data covering UK student accommodation, contact the StuRents Research team today or book a demo of our Data Portal to find out how you can have up-to-the-minute university housing insights at your fingertips.
Share

Article by
Head of Research at StuRents
Richard leads the StuRents research team, providing proprietary, platform-driven insights to help stakeholders make better-informed decisions about the market.
