
StuRents' Q3 2026 Webinar: Data roundup and latest student accommodation trends

Image courtesy of Flickr
Introduction
We recently hosted our Q3-2026 webinar, presenting the latest data and trends shaping the UK student accommodation sector.
With Clearing now underway, the latest UCAS data provides an early indication of how undergraduate demand is developing for the coming academic year. While overall acceptances remain positive, the picture beneath the headline continues to be mixed, with international growth increasingly concentrated among particular countries and higher-tariff institutions.
Elsewhere, our latest data points to an improvement in PBSA leasing compared with last year, although performance continues to vary by room type and location. Planning activity remains subdued nationally, while changing student behaviour, tenancy lengths and the growing role of Build to Rent (BTR) all add further complexity when assessing the balance between supply and demand.
Finally, as the sector continues to mature, we consider whether headline rental growth alone provides enough information to assess performance, and explore how measures incorporating occupancy and tenancy length could provide additional insight.
Clearing and undergraduate demand
Looking firstly at the UCAS data, total acceptances were up 1.5% year-on-year five days after results day.
Non-EU acceptances grew by 3.4%. While positive, this remains below the 7.4% growth in non-EU applicants reported at the June deadline, highlighting the importance of distinguishing between applications and eventual acceptances.
These figures will continue to evolve as Clearing progresses, but the early data suggests undergraduate demand remains relatively resilient.
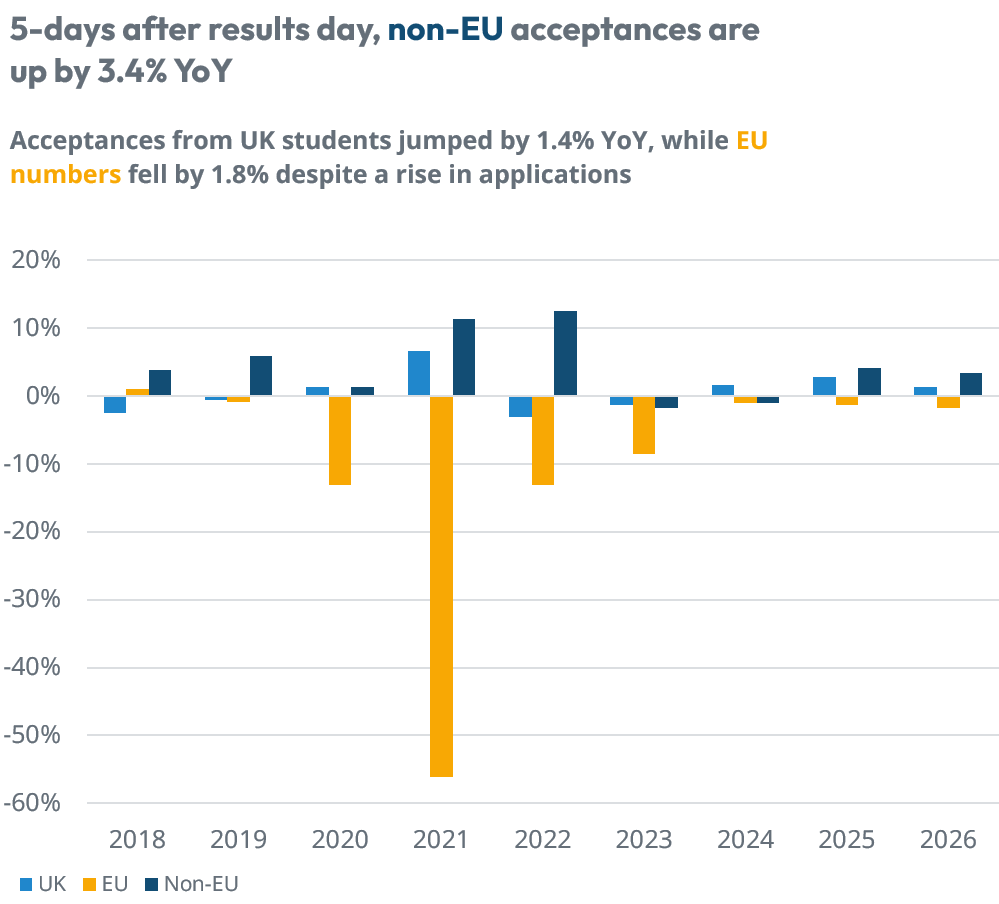
Chart 1: UCAS Acceptances by domicile group
Source: UCAS
At a country level, China continues to play an increasingly important role in international undergraduate demand. Chinese acceptances were up 13.4% year-on-year and now account for 26.7% of all international acceptances, compared with 13.1% in 2019.
While several other markets continue to report growth, the longer-term picture is more concentrated. Combined acceptances from countries other than China are around 13.6K lower than in 2017, demonstrating the extent to which recent international undergraduate growth has become reliant on the Chinese market.
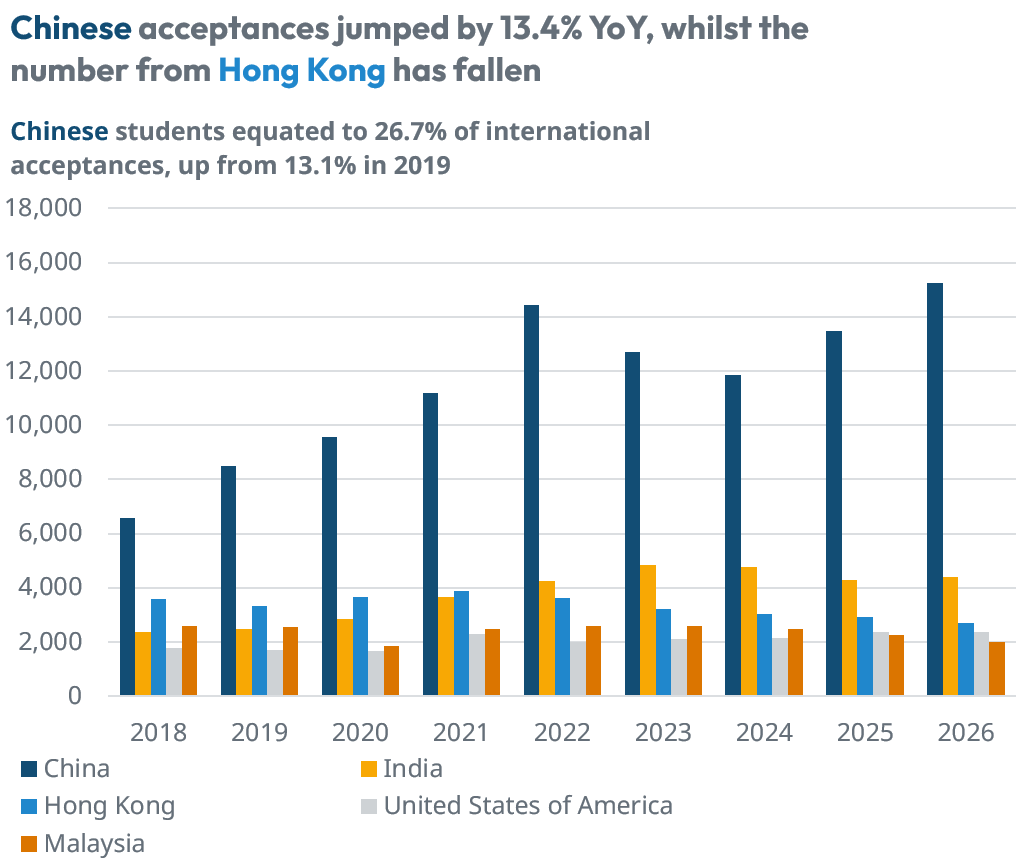
Chart 2: International acceptances by country of origin
Source: UCAS
There is also a clear divergence by university tariff. Higher-tariff providers reported acceptance growth of 5.4%, compared with 2.6% for medium-tariff providers and a 3.9% decline among lower-tariff institutions.
The trend becomes more pronounced when isolating non-EU students. Higher-tariff providers have around 15K more international acceptances than in 2017, while medium-tariff numbers have changed relatively little and lower-tariff providers remain below previous levels.
For accommodation providers and investors, this reinforces the importance of considering the individual demand dynamics of universities and locations rather than relying solely on national student growth.
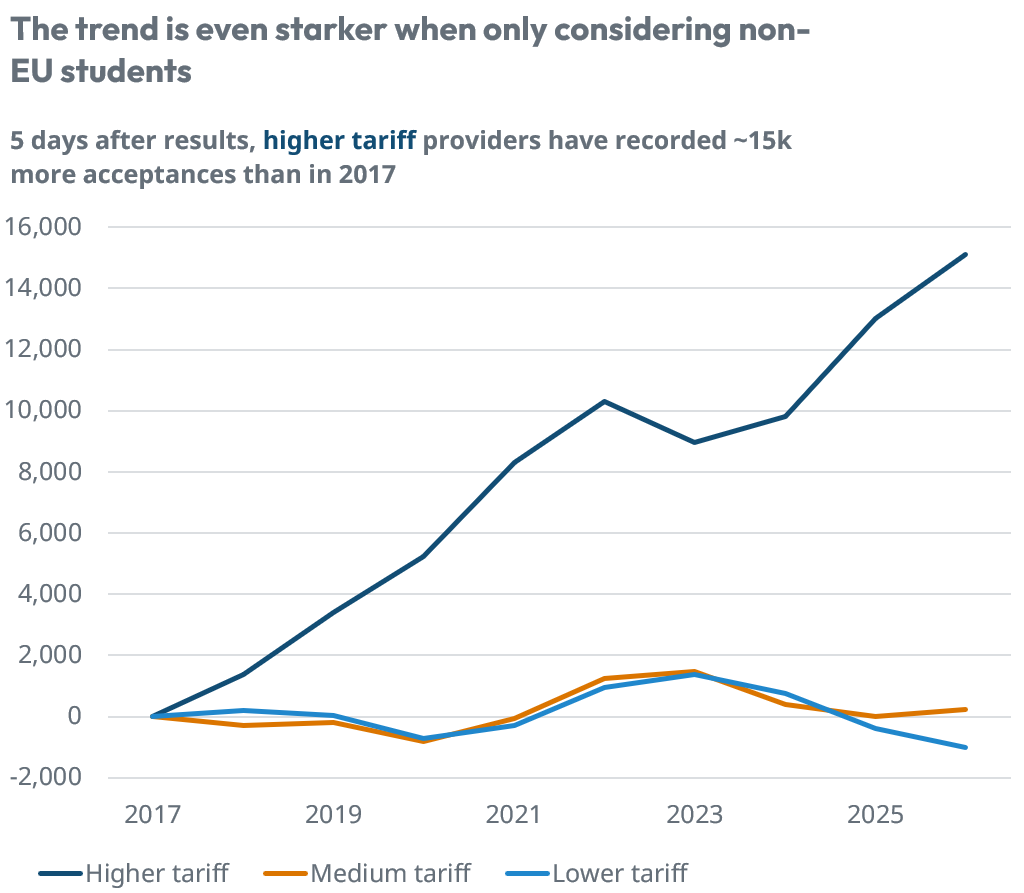
Chart 3: Non-EU acceptances by university tariff
Source: UCAS
Affordability and student behaviour
Affordability remains another important consideration.
According to UCAS, 38% of UK acceptances in 2026 expressed an intention to live at home, an increase of more than six percentage points since 2017. Among 18-year-olds specifically, the increase over the same period is 10.4 percentage points.
There are some important caveats. HESA accommodation data indicates a materially lower proportion of first-year UK students actually living at home, suggesting stated intentions do not necessarily translate directly into eventual living arrangements. Nonetheless, the direction of travel in the UCAS data provides further evidence of the affordability pressures facing students.
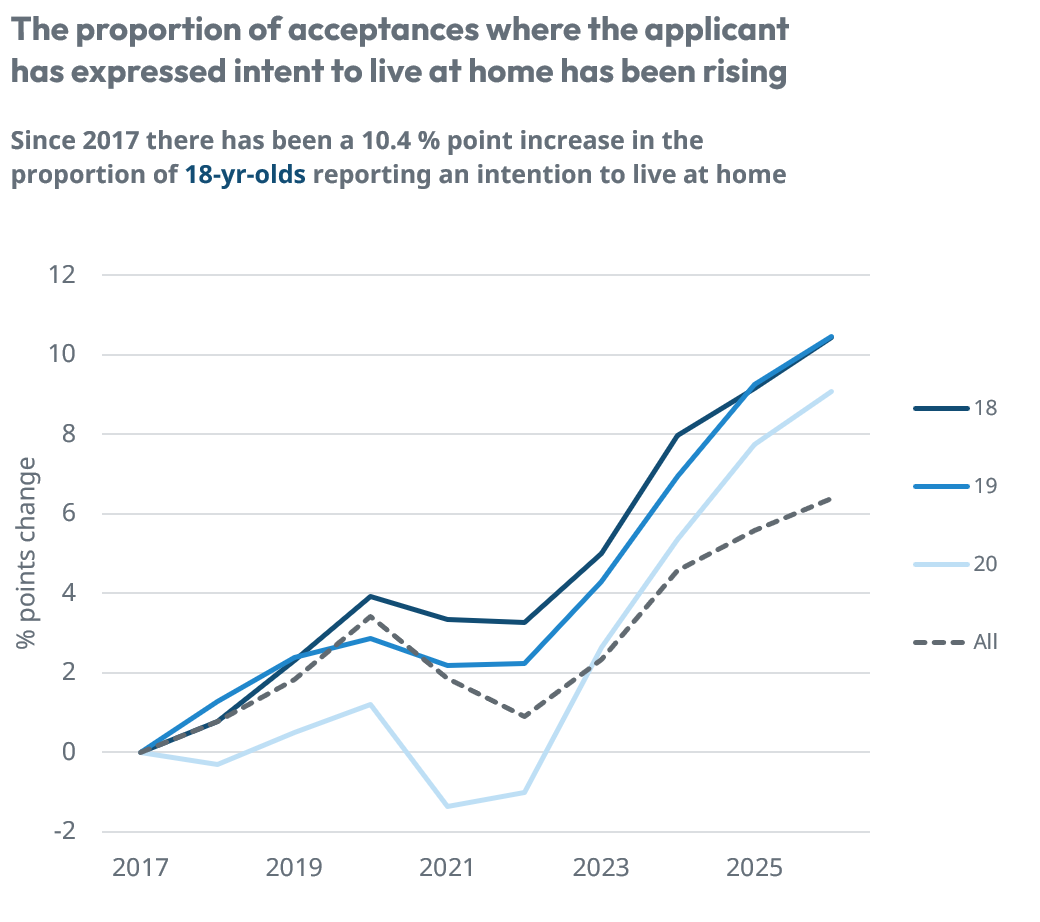 Chart 4: UK acceptances intending to live at home
Source: UCAS
Search behaviour on the StuRents platform is also changing as the lettings cycle progresses.
Studios, one-bed and two-bed properties accounted for around 61% of demand during Q3, up materially from the previous quarter. At the other end of the spectrum, searches for properties with four or more beds fell from 41% of demand in Q2 to around 22% in Q3.
This is a typical seasonal shift as larger groups tend to secure accommodation earlier in the cycle, with demand for larger properties likely to fall further as the market moves through Q4.
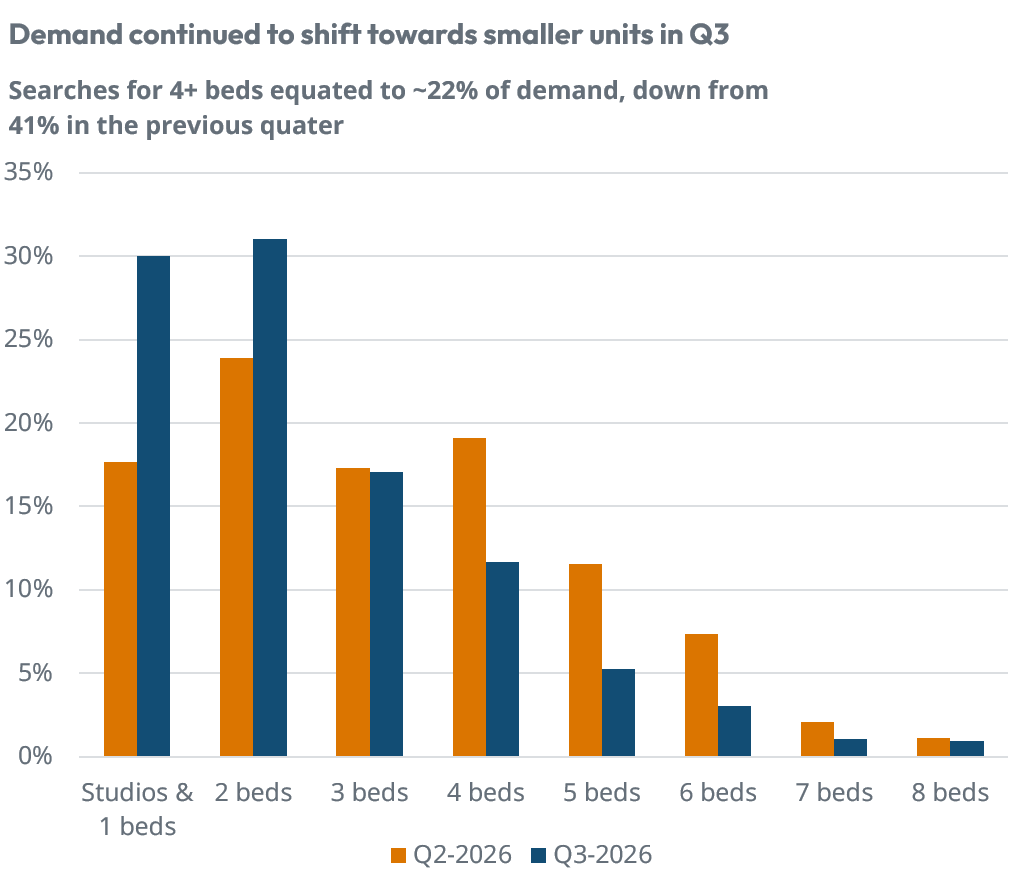 Chart 5: Search distribution by property size, Q2 vs Q3 2026
Source: StuRents Intelligence
Tenancy length provides another indication of how booking behaviour is changing.
For Chinese students signing PBSA contracts, the average tenancy length year-to-date has fallen slightly to 48.6 weeks, compared with 49.0 weeks last year. Underneath the headline average, there has also been a shift in the distribution of contracts, with 44-45 week agreements accounting for 37.6% of tenancies, up from 30.9% a year earlier.
At the same time, the average agreed headline rent has increased by 2.1% to £251.19 year-to-date, compared with £245.99 during the previous cycle.
Taken together, the figures highlight why contract length needs to be considered alongside weekly rents when assessing underlying performance.
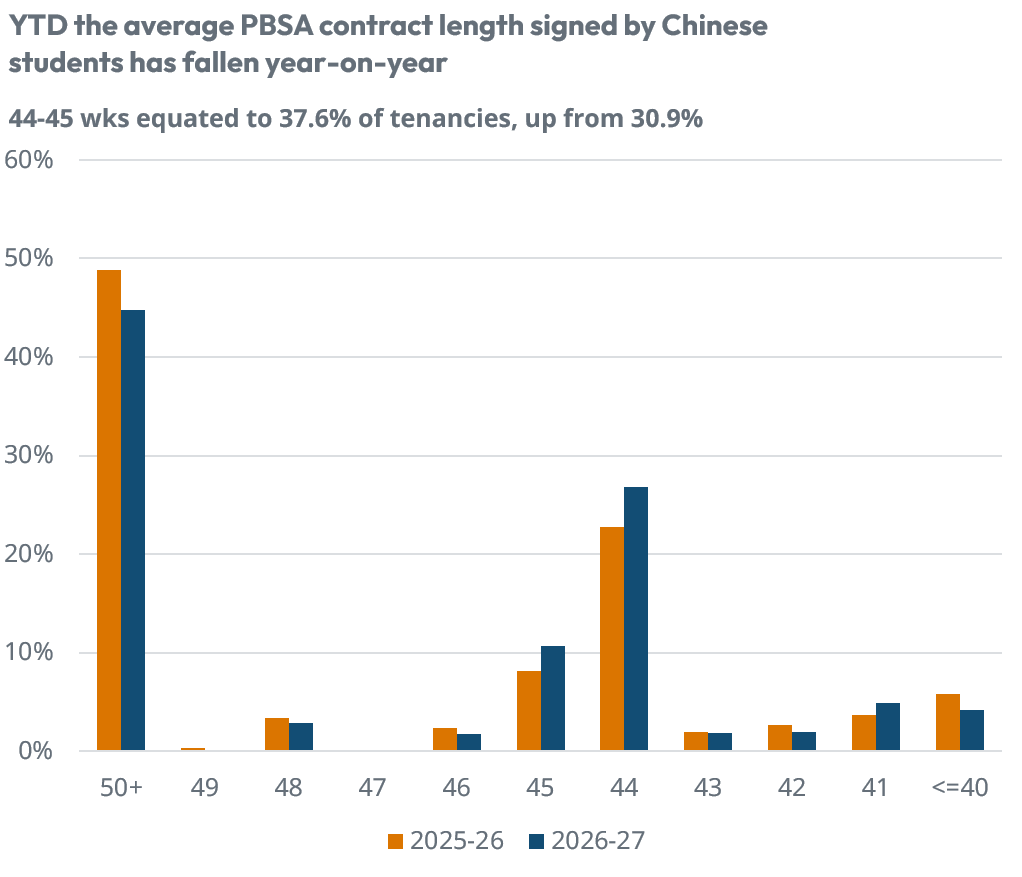
Chart 6: PBSA contract length distribution for Chinese students, 2025-26 vs 2026-27
Source: StuRents Intelligence, Concurrent
In the HMO market, British students have historically signed longer agreements, with tenancies heavily concentrated around 51 weeks. Agreed headline rents are currently £149.91 year-to-date, up 2.6% from £146.16 last year.
However, the Renters' Rights Act will change how tenancy duration is interpreted in future. With defined fixed-term lengths becoming less relevant, the eventual length of stay will only become clear once a tenant leaves.
Different landlords and operators are likely to adapt in different ways, making this an important area to monitor as the market adjusts.
International demand and study visas
Study visa applications provide a less positive signal than the undergraduate UCAS data.
As of July, sponsored study visa applications were down 19.7% year-on-year. This could point towards further pressure on postgraduate recruitment, although the two datasets cover different parts of the student population and should not be compared directly.
August is also historically the peak month for applications, while the country-level composition of the decline remains important. In particular, the implications for accommodation demand will depend partly on how key PBSA source markets such as China perform.
The final position will therefore become clearer as further visa data is released.
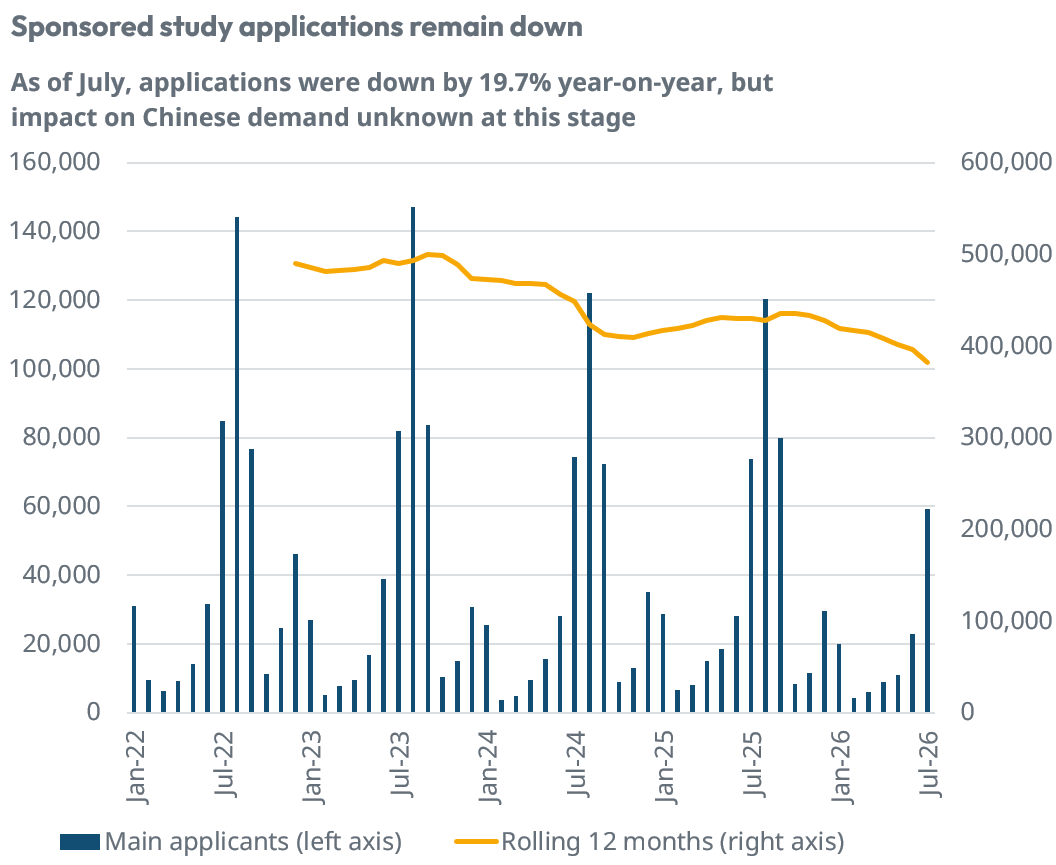
Chart 7: Sponsored study visa applications and rolling 12-month trend
Source: StuRents Intelligence, Gov.uk
PBSA occupancy
Our latest Occupancy Survey provides some encouraging signs for the 2026-27 cycle.
National PBSA occupancy reached 67.1% at the end of July, one percentage point ahead of the same stage last year. Leasing performance has therefore started to improve year-on-year, although the market continues to track behind the stronger earlier cycles.
Performance beneath the national headline continues to vary by bed type and location. We explore these trends in more detail in our July 2026 Occupancy Update, including the recent improvement in studio leasing, monthly booking momentum and the significant variation in occupancy across individual markets.
One additional trend explored during the webinar was the difference between London and the regional markets.
While the capital typically starts the leasing cycle more slowly, London has consistently moved ahead of the combined regional cities later in the year. As of July 2026, PBSA occupancy in London was 12.6 percentage points higher than across the regions in our survey.
This reinforces the importance of looking beneath national occupancy figures, with local supply and demand conditions continuing to produce materially different leasing outcomes across the UK.
London PBSA occupancy vs regional cities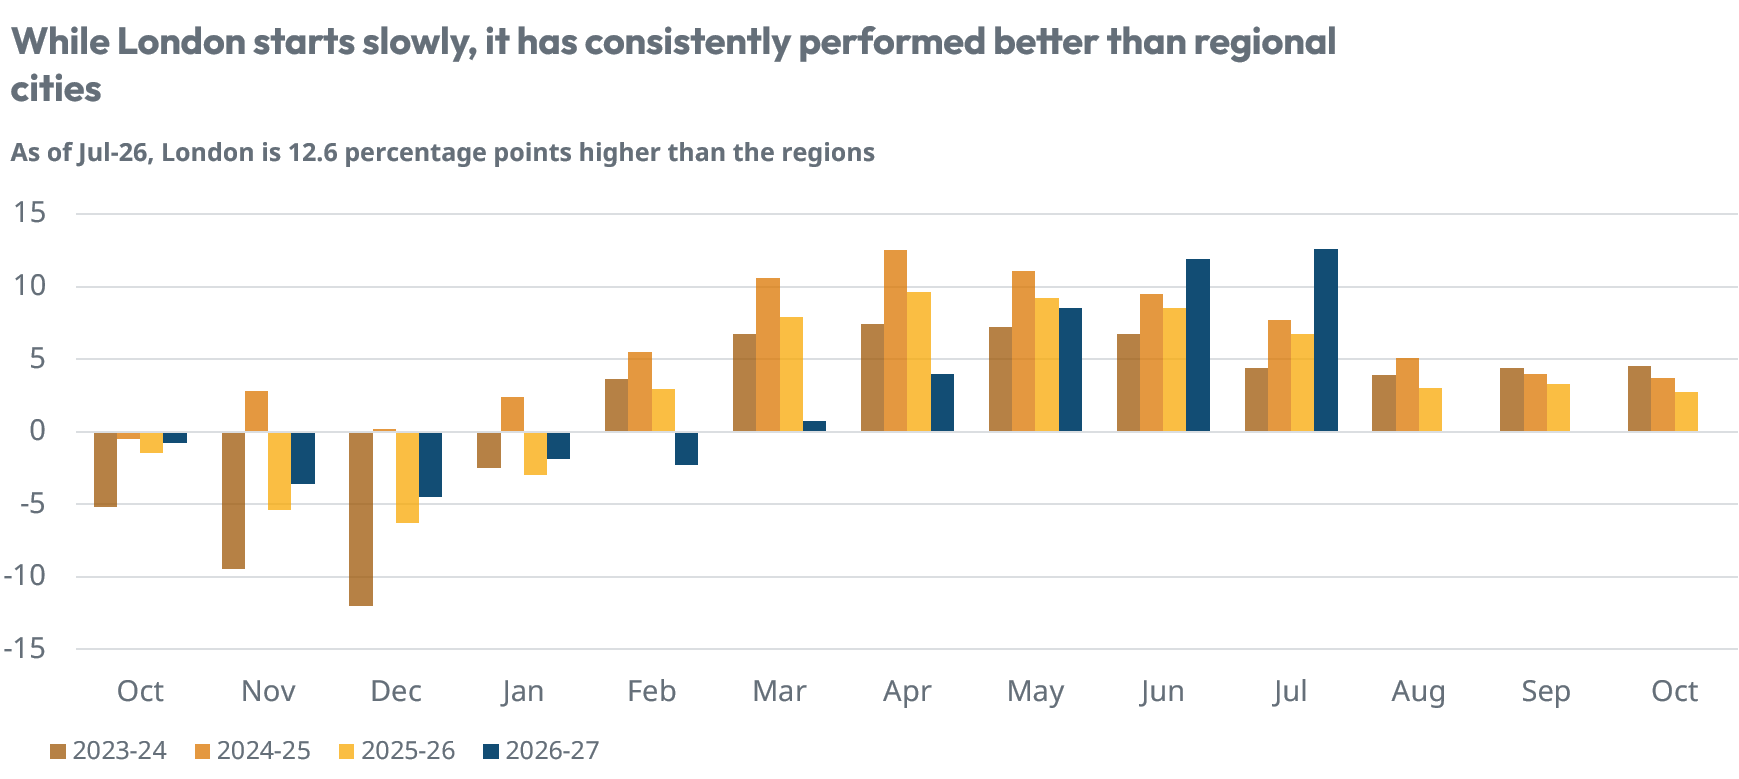
Chart 8: London PBSA occupancy vs regional cities
Source: StuRents Occupancy Survey
Planning activity remains subdued
Planning activity continues to point towards relatively constrained levels of future PBSA development.
Between January and May 2026, the number of beds submitted through planning was 45.2% lower than during the same period last year. The rolling 12-month total for submitted beds has also continued to decline, while approvals have remained at a comparatively higher level.
This divergence is important when considering the future pipeline. Although the volume of new schemes entering the planning system has fallen, a substantial number of previously submitted schemes are still progressing through the approval process.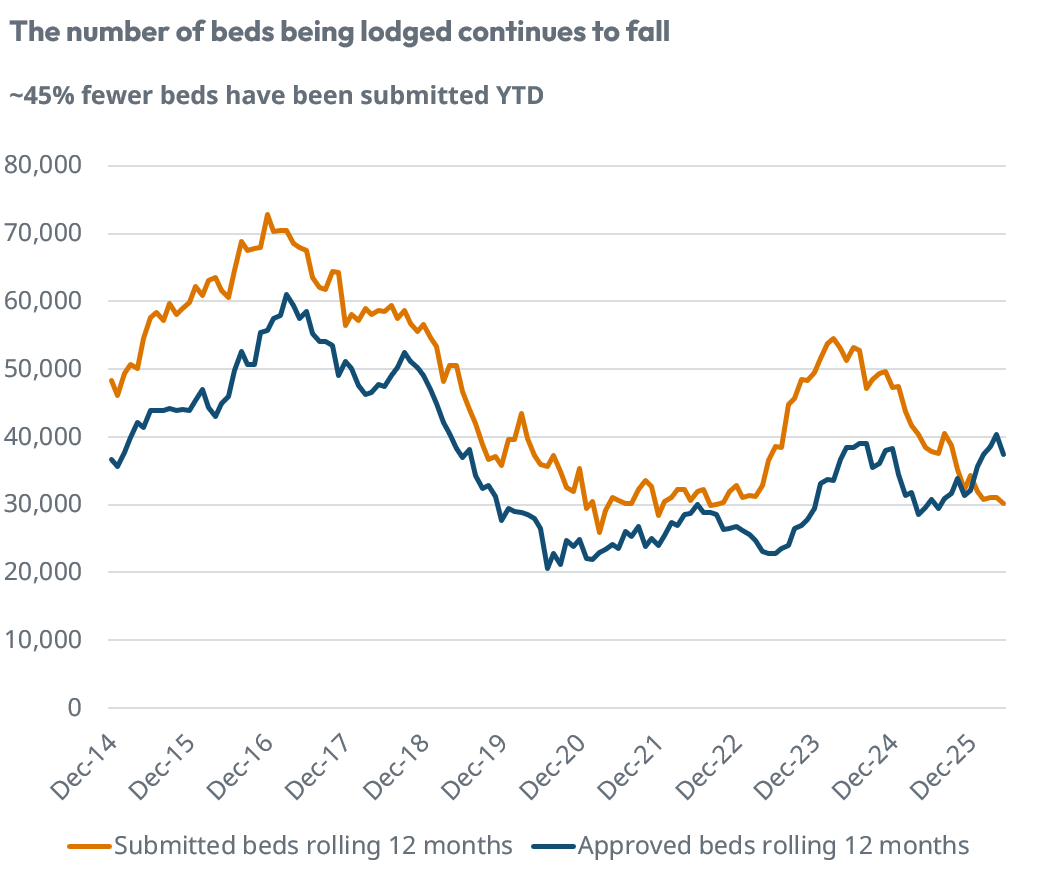
Chart 9: PBSA beds submitted and approved - rolling 12 months
Source: StuRents Intelligence
Lower national submission activity does not, however, mean that development pressure is evenly distributed across the country. Around 80% of beds submitted year-to-date are concentrated in just four locations, while individual large schemes can have a significant impact on headline figures.
This reinforces the importance of looking beyond national totals when assessing the potential future supply position of individual markets.
Looking beyond headline rental growth
As the student accommodation sector continues to mature, the metrics used to assess performance may also need to evolve.
Headline rental growth remains an important measure, but on its own it does not necessarily provide a complete picture of a scheme's performance.
Occupancy and tenancy length can both materially influence the revenue generated. A scheme could, for example, achieve higher weekly rents while simultaneously experiencing lower occupancy or shorter contracts, meaning the change in headline rent does not fully reflect the change in overall revenue.
This was a theme we explored during the webinar, where analysis of an individual scheme highlighted how rental growth and revenue growth can move differently over the course of a letting cycle.
One metric we are beginning to consider in greater detail is revenue per available room (RevPAR).
RevPAR brings revenue and available inventory together, providing a way of considering occupancy alongside the income generated by a scheme. In principle, this can provide additional context to headline rental growth, particularly where occupancy or tenancy lengths are changing.
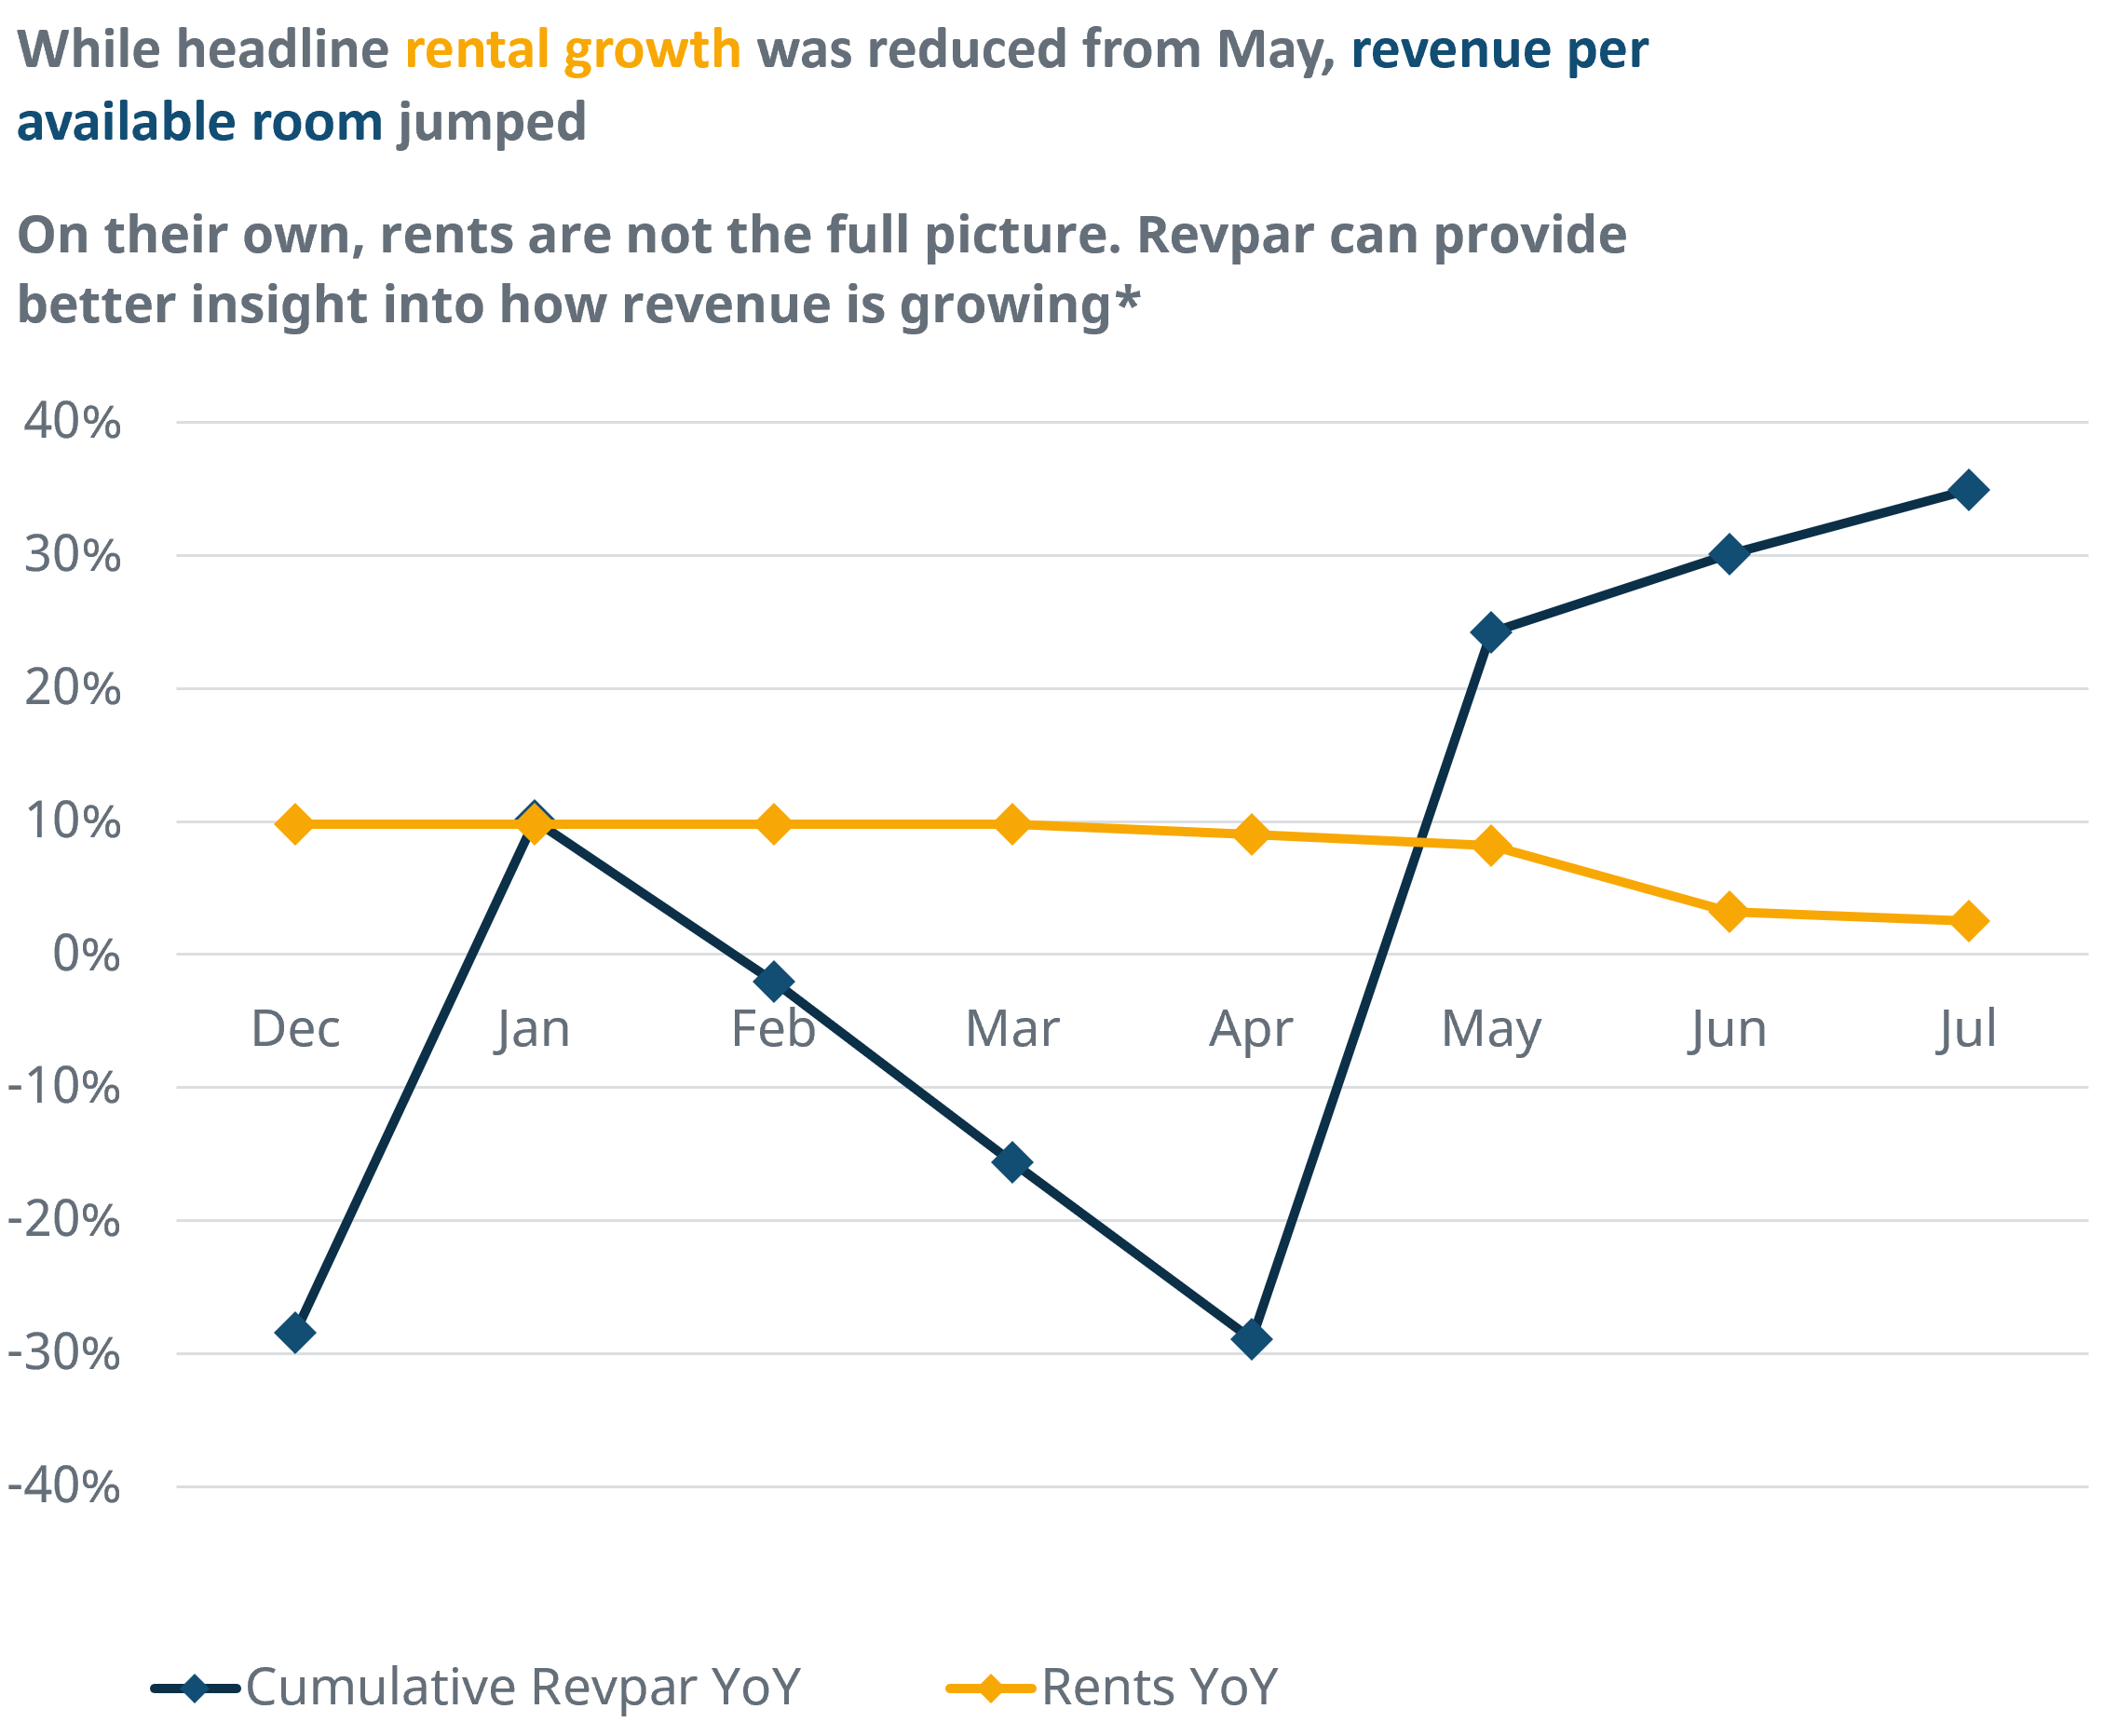
Chart 10: Illustrative cumulative RevPAR growth vs headline rental growth
Source: StuRents Intelligence, Concurrent
While the figures shown in the webinar were amended for illustrative purposes, the underlying trend was based on a real example.
At this stage, we see measures such as RevPAR as an area for further exploration rather than a replacement for existing metrics.
There are still questions around how revenue-based measures should be defined and applied consistently across the student accommodation market, particularly as operators introduce a wider range of contract lengths and more flexible letting models.
Over the coming months, we intend to explore this area in greater detail and work with the market to understand which additional measures could provide the most useful insight into underlying performance.
Market outlook
Finally, our latest market outlook highlights how changes in the wider rental market could influence the future balance between PBSA supply and student demand.
On an ex-London basis, our modelling suggests that without taking BTR into account, annual student demand growth of around 0.5% would be required to offset expected additions to PBSA supply under our assumptions.
Once the potential use of BTR accommodation by students is incorporated, that requirement increases to around 1.5%-2.0% per annum, depending on the assumptions applied.
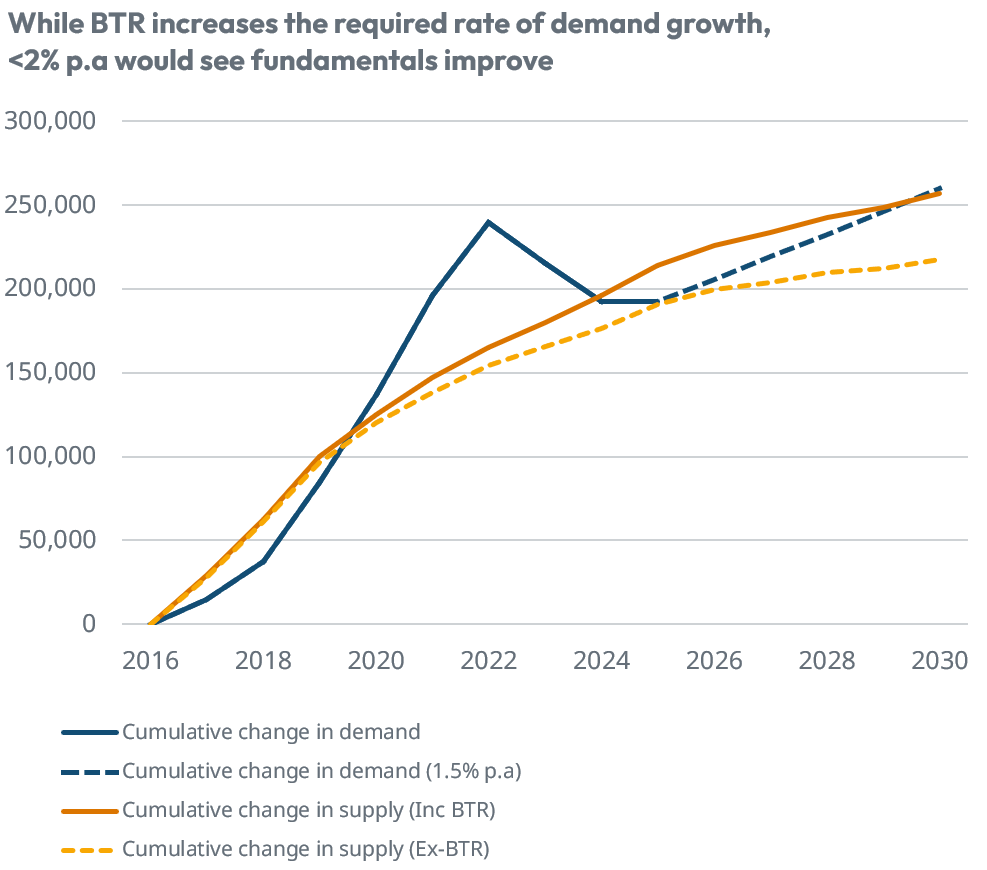 Chart 11: Student accommodation market outlook (Ex-London)
Source: StuRents Intelligence
This analysis is intended to illustrate the sensitivity of the market outlook rather than provide a forecast.
It assumes that 15% of returning UK students choose PBSA, 30% of BTR beds are occupied by students and 30% of PBSA beds currently in the pipeline are ultimately delivered. London is excluded from the analysis.
Other factors could also materially influence the outlook. Scheme withdrawals, further increases in the proportion of students choosing to live at home and changes to university provision or consolidation could all affect the balance between supply and demand.
The impact of these factors will inevitably vary significantly between locations. As ever, national statistics provide useful context, but understanding the outlook for student accommodation ultimately requires a granular view of local supply, demand, pricing and occupancy.
Find out more
For more information about our proprietary, highly granular data covering UK student accommodation contact the StuRents Research team today. Book a demo of our Data Portal to find out how you can have up-to-the-minute university housing insights at your fingertips, or get in touch with us about our Occupancy Survey.
Share

Article by
Research Analyst at StuRents
Calum Martin is a research analyst in StuRents’ research division, StuRents Intelligence.
