
Student Budgets Continue to Climb

Key findings
- For the 2023-24 cycle, the average HMO listing view has increased by 4.1% year-on-year.
- So far in the 2023-24 letting cycle, the average price of HMOs being viewed by UK students was £139pppw.
- Most UK students continue to search for clusters with 4 & 5 beds popular
- Studios remain the most popular unit size for south-east Asian students.
National HMO Listing Views - UK Students
By analysing the price points of properties being viewed on the platform, users can start to understand trends between both accommodation types and demographics.
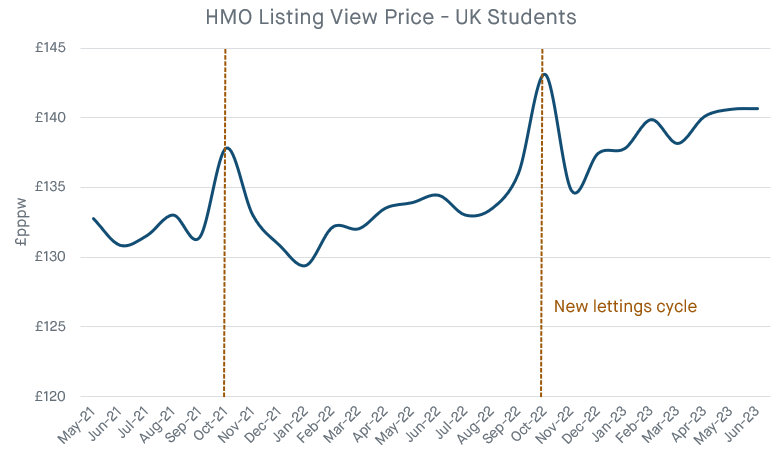
The first chart below considers HMO listing views made by UK students outside of the capital. Over time, there has been a clear upward trend, a sign of strong supply vs demand fundamentals including rental growth. What is interesting to note is the spike in prices at the start of the lettings season (Oct). This indicates that UK students that are house hunting early are prepared to pay a premium for the best HMOs on offer. Most recently, the coverage around Durham and students queuing overnight to secure their accommodation is a reflection of this trend. Whilst such queues are not necessarily representative of a shortage of beds per se, it does suggest the best properties are in high demand and in low supply, hence the need to move early.
If we consider all of the HMO listing views made by UK students outside of London, then the weighted average for the 2022-23 cycle was £133.16pppw. In comparison, so far this year a figure of £138.56pppw has been recorded, representing an increase of 4.1% YoY.
Source: StuRents
HMO Listing Views per City
As always there remain significant differences between the national picture and the fundamentals of an individual city.
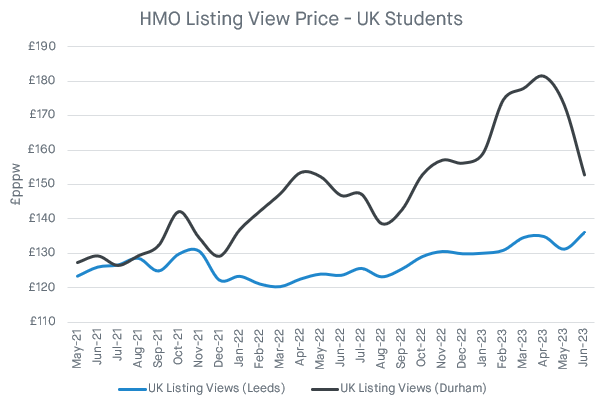
In the chart below we have highlighted the difference in HMO listing views between Leeds and Durham. Immediately, it is obvious that UK students searching for HMO properties in Durham have been viewing listings at significantly higher prices. For example, so far in the 2023-24 cycle the average listing view price has been £163.84pppw. This compares to Leeds where an average of £130.88pppw has been recorded.
Additionally, the price points of HMOs being viewed across both locations have increased albeit to varying degrees. In Durham the average listing view has increased by a significant 16.7% year-on-year, whilst in Leeds the jump has been more modest at 4.1%.
Source: StuRents
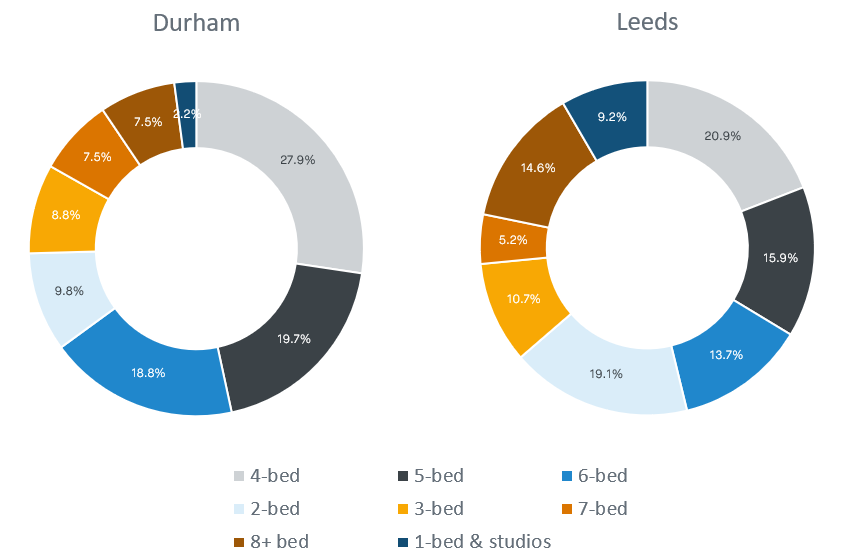
Utilising our demand-side data we can also begin to understand the preferences of students for different unit mixes. The chart below highlights of those HMOs being viewed in either Durham or Leeds, how many beds were been looked for.
Taking Durham, we can see that 27.9% of views were for 4-bed properties, whilst a significant proportion of views were attributed to 5 and 6 beds, at 19.7% and 18.8% respectively. Meanwhile, in Leeds, it was slightly more evenly distributed. Of those listing views made, 20.9% were for 4 beds and 15.9% were for 5 beds. The ability of a house-hunting student to view a property of a particular size will be determined partly by the type of supply on offer. However, the data highlights the preference of UK students to search in groups and the desire to take multiple beds as part of one booking.
Source: StuRents
PBSA Listing Views by Demographic
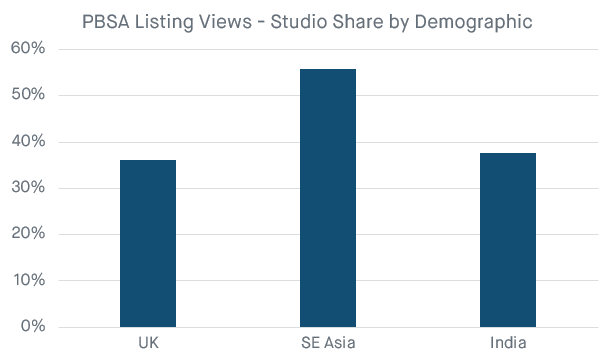
What is also interesting to consider is the differences in unit mix preference across demographics. The chart below considers of those PBSA listing views made by students, what proportion were for studios and how does this differ between key groups.
Isolating demand from UK students, the chart highlights that 36.1% of PBSA listing views were for studios. In comparison, views for studios from Indian students were marginally higher at 37.6%. Unsurprisingly, this figure jumps considerably for students from South East Asia (55.7%).
Source: StuRents
SE Asia includes China, Hong Kong, South Korea, Singapore
The data above highlights how demand has been changing over time and the key differences between demographics. For stakeholders, having a grasp of the latest trends can be pivotal when considering future opportunities and risks. Equally, with demographics constantly changing, understanding the differences in demand profiles can be hugely important when deciding on appropriate marketing strategies.
For more information about our proprietary, highly granular data covering the UK student accommodation contact the StuRents Research team today. Or book a demo of our Data Portal to find out how you can have up-to-the-minute university housing insights at your fingertips.
Share

Article by
Head of Research at StuRents
Richard leads the StuRents research team, providing proprietary, platform-driven insights to help stakeholders make better-informed decisions about the market.
