
Student Accommodation Research: Q1 PBSA Occupancy

Q1 PBSA Occupancy
The StuRents Q1 Quarterly Reports are now available!
Every quarter, the research team at StuRents hosts a webinar to coincide with the release of reports for 46 university cities and towns across the UK, plus a national report for the UK. In Q1, a key section of the webinar focuses on booking velocity across key market locations. These insights are based on the output of the StuRents Occupancy Survey.
PBSA occupancy remains a critical insight for industry stakeholders. Whether it is simply used for benchmarking against the market or to help with dynamic pricing strategies, timely and accurate information on occupancy (booking velocity) ensures users can make informed decisions backed up by data.
At StuRents, we have worked in collaboration with the industry to provide our members with such insights.
Glasgow
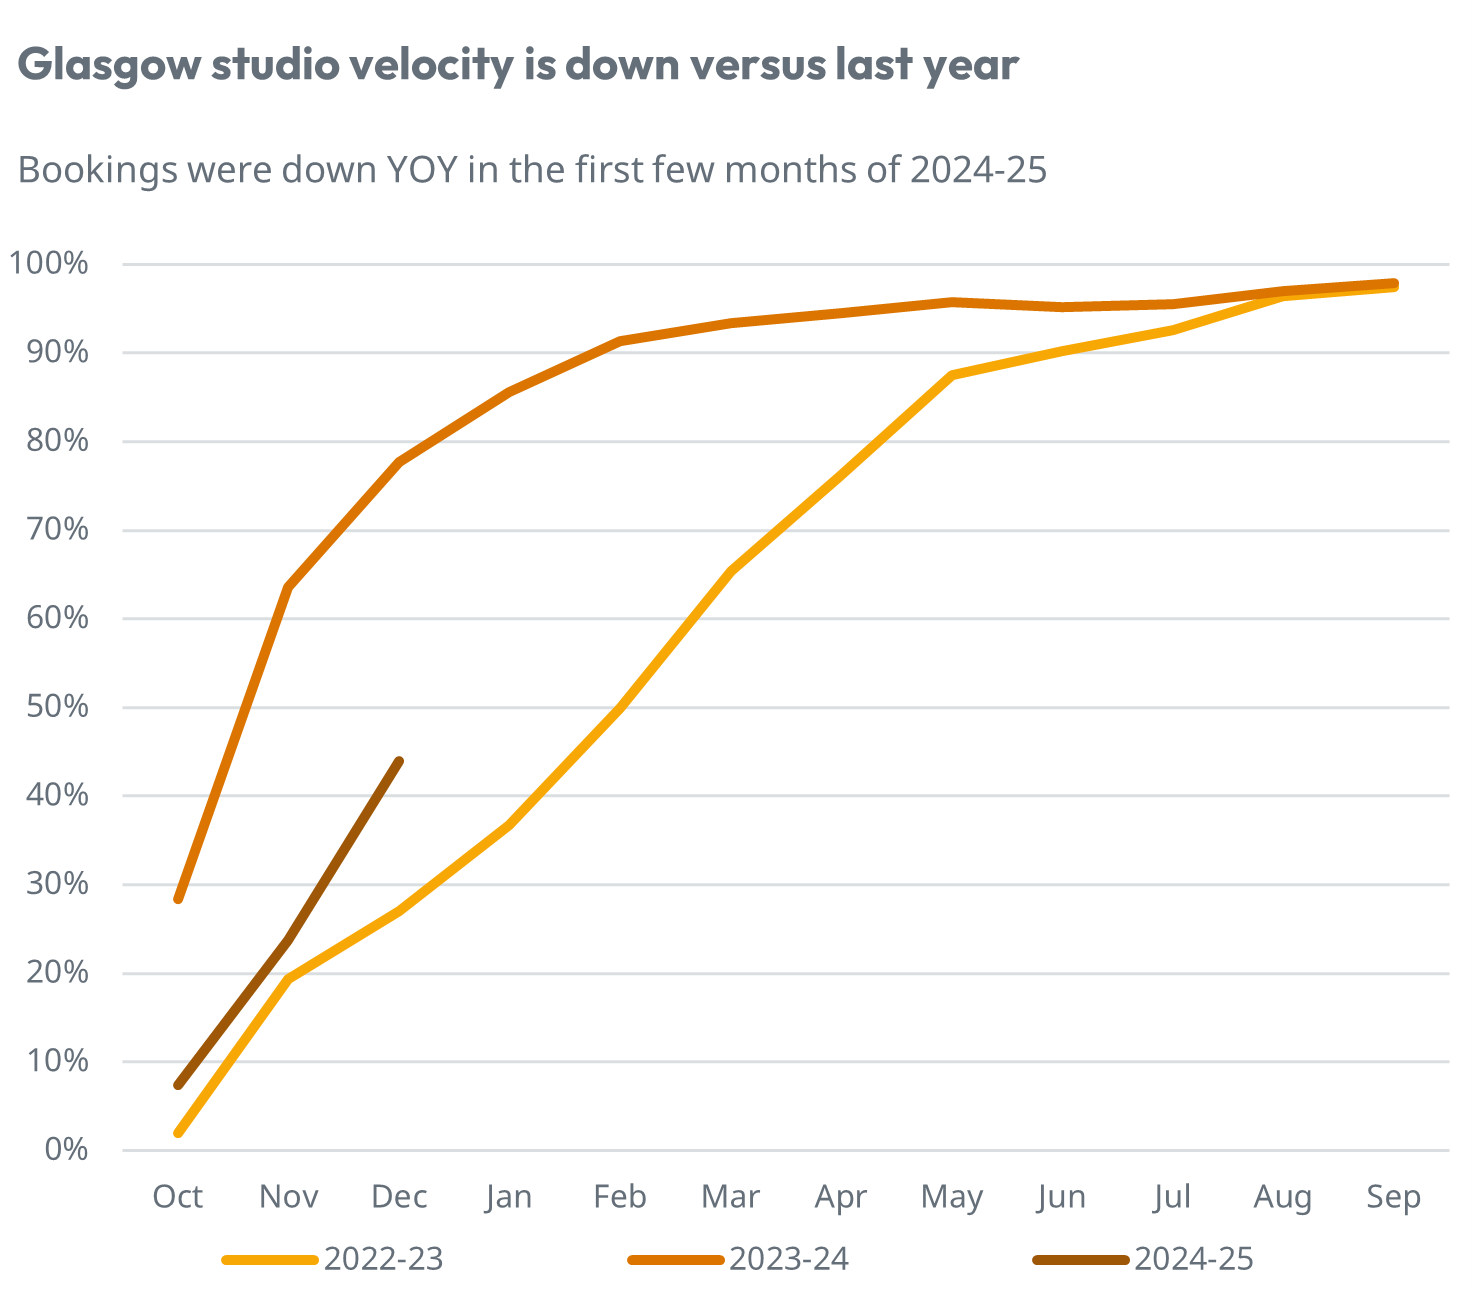
Source: StuRents Limited
The chart shows the market booking levels each month in Glasgow for the current and two previous letting cycles.
Last year, markets such as Glasgow witnessed significant growth in booking velocity, which in turn led to strong rental growth and a scramble for accommodation. Whilst some of this positivity was tempered later in the year with the emergence of fake bookings and the accreditation scandal, leading to late voids, the speed at which rooms were sold was extremely high.
For example, by the end of December 2022, across participating members, 78% of studios were booked. Fast forward 12 months and the latest data indicates this has dropped to 44%. This represents a significant shift year-on-year, albeit it remains above the position recorded in 2022-23 (27%). A similar trend has been observed for clusters in Glasgow, with 42% booked by the end of 2023, down from 75% the previous year.
Despite the aforementioned slowdown, Glasgow remains far ahead of some of the more challenging locations.
Sheffield
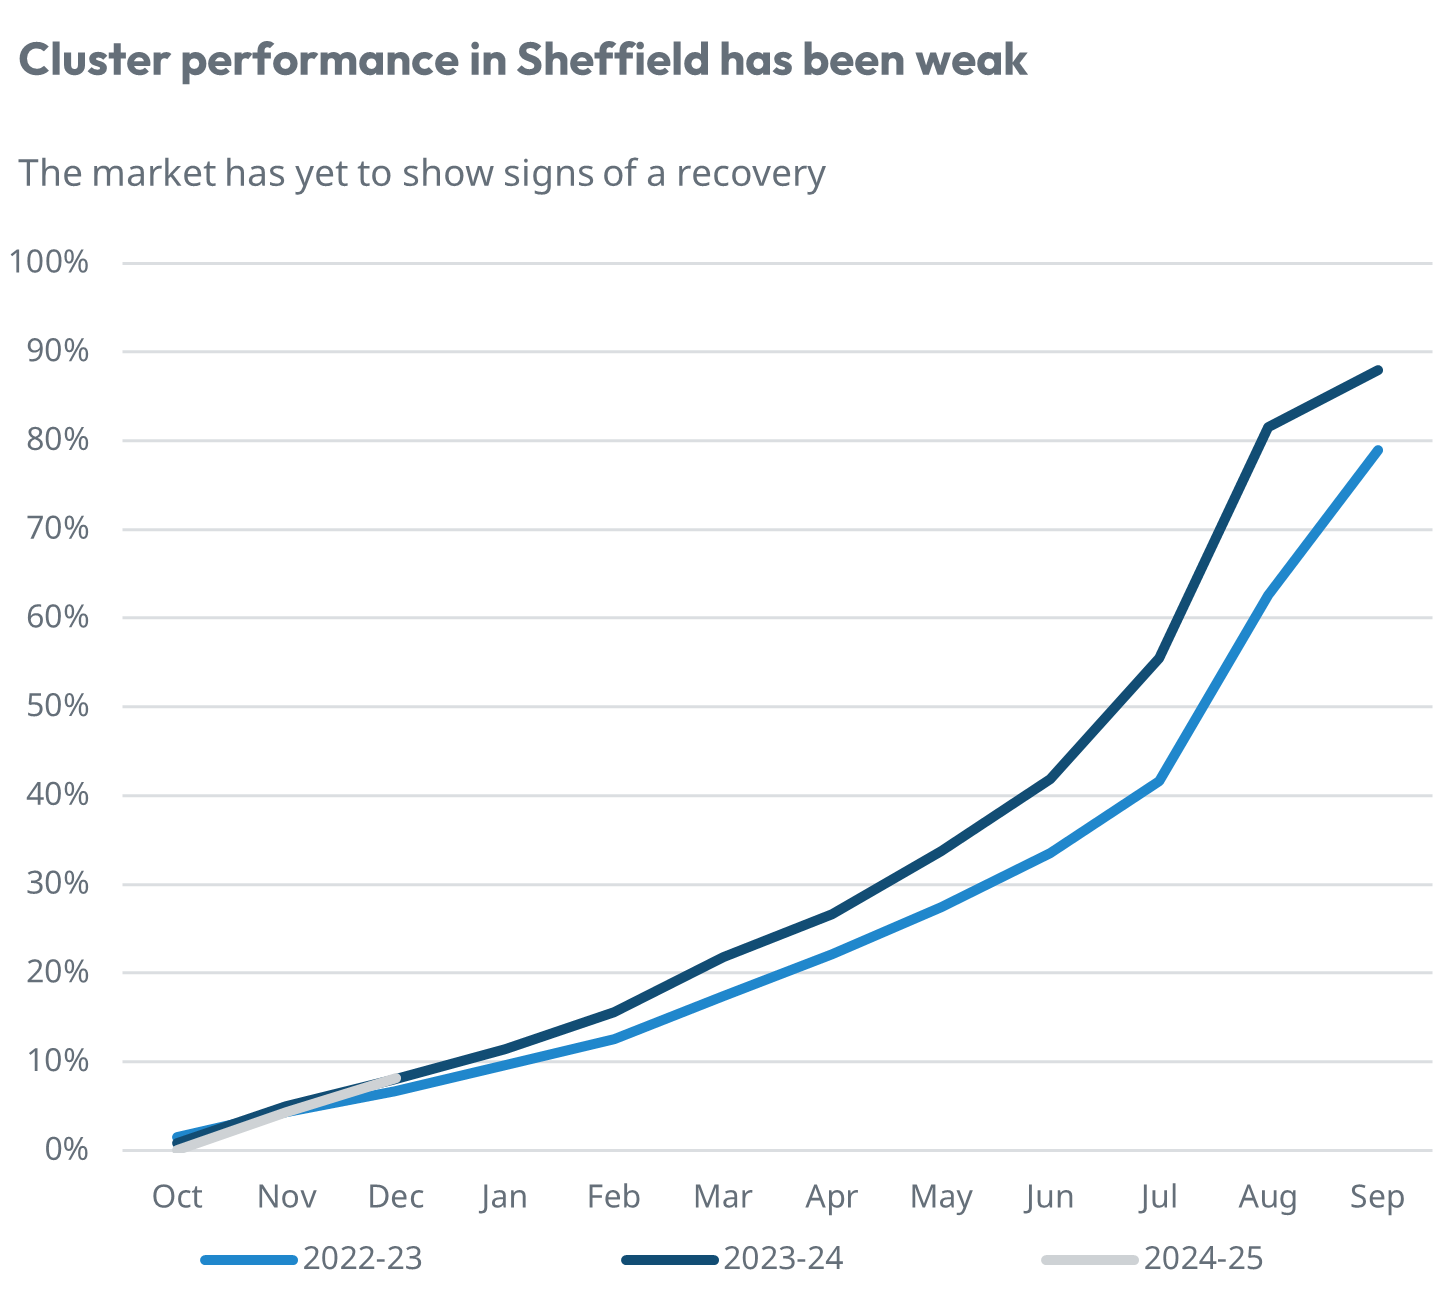
Source: StuRents Limited
The chart shows the market booking levels each month for student accommodation in Sheffield for the current and two previous letting cycles.
In Sheffield, at the end of 2023, studio and cluster occupancy for the 2024-25 intake stood at just 17% and 8% respectively, highlighting the vast differences in performance between locations.
Elsewhere, studios in Exeter and Southampton have also seen year-on-year declines. In the former location, members were reporting studio occupancy of 25% in December (2022: 29%), whilst in Southampton, this stood at 56% (2022: 64%).
One possible reason for the year-on-year reduction in booking velocity in some of the locations mentioned is a more cautious approach from operators. For example, it has been noted that some have increased their deposit requirements to mitigate against a repeat of issues faced last year, specifically around fake bookings. Of course, tighter risk management, such as requesting deposits or proof of ID at the point of booking, can help reduce this risk but must be weighed up against deterring genuine interest.
Having this almost live understanding of how an asset is performing against the market is invaluable for stakeholders when making real-time decisions on pricing, marketing, and reporting.
The only way to get these key occupancy insights is as a member via the StuRents Intelligence Portal. Interested parties can register their interest in becoming a member by contacting the research team.
StuRents' Quarters
Recently our Head of Research, Richard Ward, was joined by Brodie Berman, Senior Acquisitions Associate at Fusion Group, and TONG Partner & Client Services Director, Gabriel Nicklin. The three discuss key trends in the student accommodation sector. Based on research from our quarterly reports and our unique, proprietary data, they explore:
- Demand growth per demographic, as revealed by this year's end-of-cycle statistics from UCAS. Read more.
- Changing student search behaviour and the price points students have been considering. Read more.
- Updates to market supply and the supply pipeline. Read more.
- Booking velocity across key market locations, as described above.
We also asked our audience for their thoughts on some interesting market developments, the results of which can be viewed here.
A recording of the webinar is available to view here.
Share

Article by
Research Analyst at StuRents
Aisling Murphy is a research analyst in StuRents’ research division, StuRents Intelligence.
